 NATURALGAS
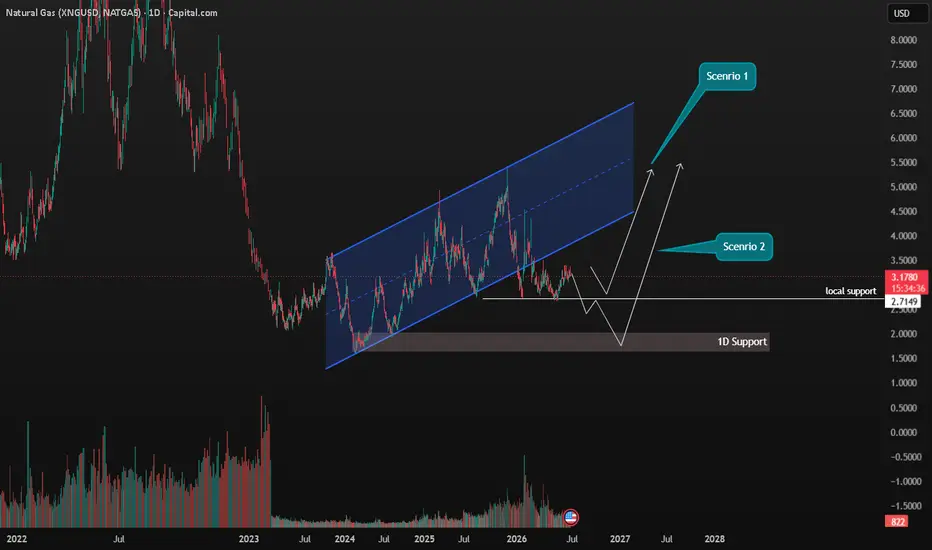
 Natural Gas is currently trading at 3.1770 on the daily timeframe, exhibiting a critical structural shift. After respecting a broad, multi-year ascending parallel channel from mid-2023 through early 2026, the price action has recently broken down below the channel's lower boundary. The market is now consolidating just above key horizontal demand structures, presenting two distinct forward-looking setups.
Key Technical Elements
Ascending Channel Breakdown: The price has decisively breached the bottom trendline of the primary ascending channel. In technical analysis, this typically indicates an exhaustion of medium-term bullish momentum, forcing the market to look deeper for structural liquidity before initiating the next macro cycle.
Local Support Zone: An immediate horizontal support line is mapped at 2.7149. This level represents a prior key swing low and consolidation pivot point.
Macro 1D Support Block: A major long-term accumulation zone is established lower down, ranging between 1.6000 and 2.0000. This block aligns with the absolute macro floor formed during the mid-2023 bottom.
Anticipated Price Action & Scenarios
The chart explicitly outlines two primary actionable scenarios, both concluding in an ultimate macro bullish expansion but relying on different accumulation depths.
Scenario 1: Local Support Hold & Reversal
The Path: The price continues its short-term downward drift to test the local support at 2.7149.
Mechanics: Buyers step in aggressively at this key level, creating a minor relief bounce followed by a successful retest of the 2.7149 line as a solid floor.
Target: Once validated, an impulsive bullish reversal carries the price back upward to re-enter the previous macro range, targeting values well above the 5.5000 handle into 2027.
Scenario 2: Liquidity Sweep of the Macro 1D Support (Deep Flush)
The Path: The local support at 2.7149 fails to hold the selling pressure, leading to a breakdown.
Mechanics: The market undergoes a deeper capitulation phase, plunging straight into the 1D Support block (1.6000 - 2.0000). This drop functions as a massive stop-hunt to clear out remaining retail buyers and late short-sellers.
Target: Upon tapping this deep demand pool, institutional buy orders trigger a sharp, V-shaped rejection. This powerful momentum shifts the macro structure back to bullish, driving an aggressive expansion phase targeting the same overhead macro levels.
Conclusion
The daily chart for Natural Gas indicates that while the breakdown from the ascending channel signals short-term bearishness, the asset is approaching prime accumulation territory. Traders should monitor the 2.7149 local support closely. A high-volume rejection candle at this level confirms Scenario 1. Conversely, a clean breach of 2.7149 will trigger Scenario 2, offering an even higher-confluence, deep-discount buying opportunity inside the 1.6000 - 2.0000 macro support block.

welcome to 'Trades With Malik' for VVIP group and signal contact me at my telegram @tradeswithmalik7
Happy trading
Happy trading
Wyłączenie odpowiedzialności
Informacje i publikacje nie stanowią i nie powinny być traktowane jako porady finansowe, inwestycyjne, tradingowe ani jakiekolwiek inne rekomendacje dostarczane lub zatwierdzone przez TradingView. Więcej informacji znajduje się w Warunkach użytkowania.
welcome to 'Trades With Malik' for VVIP group and signal contact me at my telegram @tradeswithmalik7
Happy trading
Happy trading
Wyłączenie odpowiedzialności
Informacje i publikacje nie stanowią i nie powinny być traktowane jako porady finansowe, inwestycyjne, tradingowe ani jakiekolwiek inne rekomendacje dostarczane lub zatwierdzone przez TradingView. Więcej informacji znajduje się w Warunkach użytkowania.