
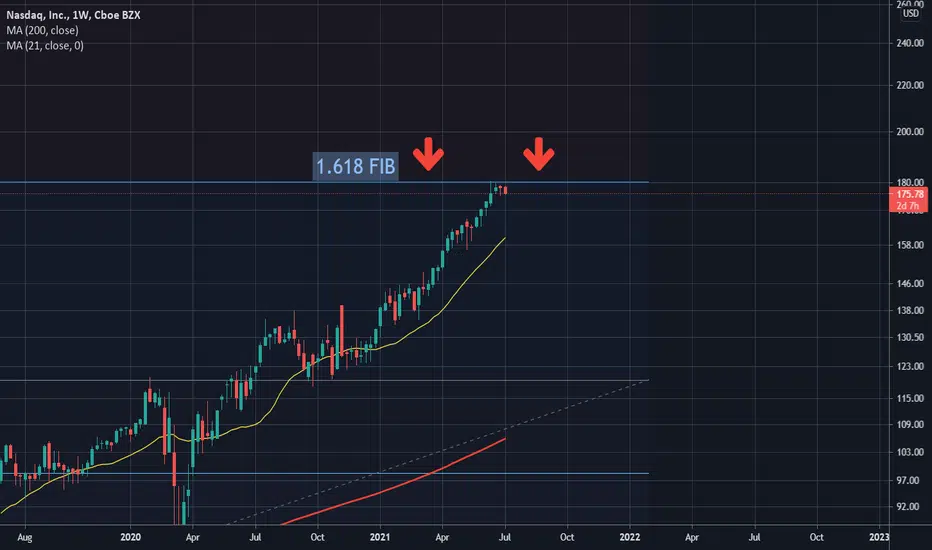
The weekly chart of the Nasdaq index is showing weakness with multiple weekly candle rejections at exactly the 1.618 fibonacci extension level.
This is key to note as the 1.618 as many know is often the first place traders short, sell and or take profits after price breaks all time high. So paying attention to the $180 level will be important. If bulls can ever get a weekly close above this level, the run up can continue.
Until then, proceed with caution this week and probably the next if your portfolio is very tech stock heavy.
This is key to note as the 1.618 as many know is often the first place traders short, sell and or take profits after price breaks all time high. So paying attention to the $180 level will be important. If bulls can ever get a weekly close above this level, the run up can continue.
Until then, proceed with caution this week and probably the next if your portfolio is very tech stock heavy.

Powiązane publikacje
Wyłączenie odpowiedzialności
Informacje i publikacje nie stanowią i nie powinny być traktowane jako porady finansowe, inwestycyjne, tradingowe ani jakiekolwiek inne rekomendacje dostarczane lub zatwierdzone przez TradingView. Więcej informacji znajduje się w Warunkach użytkowania.
Powiązane publikacje
Wyłączenie odpowiedzialności
Informacje i publikacje nie stanowią i nie powinny być traktowane jako porady finansowe, inwestycyjne, tradingowe ani jakiekolwiek inne rekomendacje dostarczane lub zatwierdzone przez TradingView. Więcej informacji znajduje się w Warunkach użytkowania.