
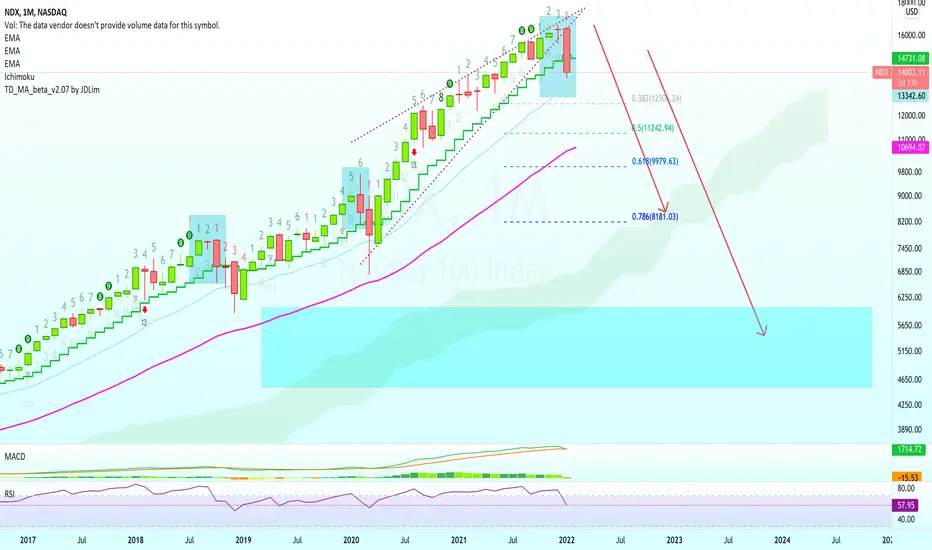
I will be showing you three timeframes and very likely the last reminder before the major crash.
The NASDAQ-100 Index continues all RED, we start with the daily timeframe:
- On the chart above we have the NDX daily chart.
- We can see all the EMAs being broken as support.
- Extremely bearish indicators: MACD & RSI.
- Just today prices are moving below EMA300, Friday.
This can lead to a bearish weekly and monthly closes.
We continue with the weekly timeframe for the NDX:

- Weekly, we can see prices closing below EMA50 for the first time since February 2020.
- After the break below EMA50 back in 2020 a strong correction happened, something similar can repeat.
- We have a strongly bearish MACD.
- We also have a GAP/Window on the current candle opening price vs previous candle closing price.
Finally, this is the timeframe we looked at two days ago in a previous/related trade idea... The NASDAQ-100 (NDX) Index on the monthly timeframe, this one gives it away completely:
When we look at the monthly timeframe, we no longer go back to March 2020 COVID for the strongest correction, it goes back to 2008. We have a 50%+ correction (A -53.53% drop on the NDX).
Now, the current candle, January 2022, is the strongest bearish candle since September 2008 and it has other peculiarities.
Let's zoom in:
- We have a shooting star candlestick on Nov. '21.
- We have a Doji last monthly (Dec. '21).
- We have a full bearish breakdown this month (Jan. '22).
- The currently candle went through Junes 2021 candles real body on the downside. That's six month of growth removed in a few weeks.
All the timeframes agree.
The technical picture continues to be bearish.
Remember to share, follow, like & comment for more.
Thanks a lot for your continued support.
Namaste.
The NASDAQ-100 Index continues all RED, we start with the daily timeframe:
- On the chart above we have the NDX daily chart.
- We can see all the EMAs being broken as support.
- Extremely bearish indicators: MACD & RSI.
- Just today prices are moving below EMA300, Friday.
This can lead to a bearish weekly and monthly closes.
We continue with the weekly timeframe for the NDX:
- Weekly, we can see prices closing below EMA50 for the first time since February 2020.
- After the break below EMA50 back in 2020 a strong correction happened, something similar can repeat.
- We have a strongly bearish MACD.
- We also have a GAP/Window on the current candle opening price vs previous candle closing price.
Finally, this is the timeframe we looked at two days ago in a previous/related trade idea... The NASDAQ-100 (NDX) Index on the monthly timeframe, this one gives it away completely:
When we look at the monthly timeframe, we no longer go back to March 2020 COVID for the strongest correction, it goes back to 2008. We have a 50%+ correction (A -53.53% drop on the NDX).
Now, the current candle, January 2022, is the strongest bearish candle since September 2008 and it has other peculiarities.
Let's zoom in:
- We have a shooting star candlestick on Nov. '21.
- We have a Doji last monthly (Dec. '21).
- We have a full bearish breakdown this month (Jan. '22).
- The currently candle went through Junes 2021 candles real body on the downside. That's six month of growth removed in a few weeks.
All the timeframes agree.
The technical picture continues to be bearish.
Remember to share, follow, like & comment for more.
Thanks a lot for your continued support.
Namaste.

🔥 Get the FULL (4-in-1) PREMIUM PACKAGE 👇
t.me/lamatrades/4 (Since 2017)
✅ FREE PREMIUM trade-numbers (4-10X) 👇
t.me/masteranandatrades/9043
🚨 TOP Results May 2026 👇
t.me/masteranandatrades/8778
t.me/lamatrades/4 (Since 2017)
✅ FREE PREMIUM trade-numbers (4-10X) 👇
t.me/masteranandatrades/9043
🚨 TOP Results May 2026 👇
t.me/masteranandatrades/8778
Powiązane publikacje
Wyłączenie odpowiedzialności
Informacje i publikacje nie stanowią i nie powinny być traktowane jako porady finansowe, inwestycyjne, tradingowe ani jakiekolwiek inne rekomendacje dostarczane lub zatwierdzone przez TradingView. Więcej informacji znajduje się w Warunkach użytkowania.
🔥 Get the FULL (4-in-1) PREMIUM PACKAGE 👇
t.me/lamatrades/4 (Since 2017)
✅ FREE PREMIUM trade-numbers (4-10X) 👇
t.me/masteranandatrades/9043
🚨 TOP Results May 2026 👇
t.me/masteranandatrades/8778
t.me/lamatrades/4 (Since 2017)
✅ FREE PREMIUM trade-numbers (4-10X) 👇
t.me/masteranandatrades/9043
🚨 TOP Results May 2026 👇
t.me/masteranandatrades/8778
Powiązane publikacje
Wyłączenie odpowiedzialności
Informacje i publikacje nie stanowią i nie powinny być traktowane jako porady finansowe, inwestycyjne, tradingowe ani jakiekolwiek inne rekomendacje dostarczane lub zatwierdzone przez TradingView. Więcej informacji znajduje się w Warunkach użytkowania.