
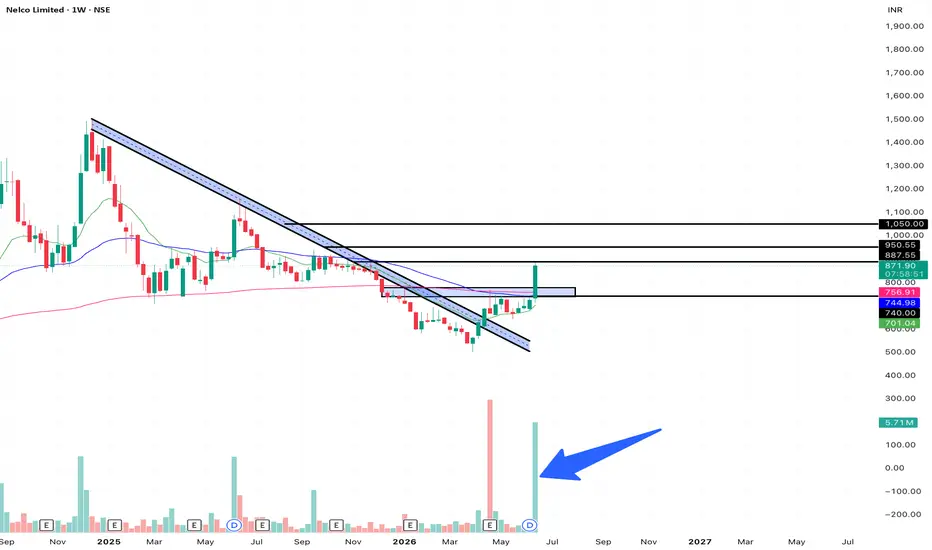
📊 Nelco Limited (NELCO) - Weekly Chart Analysis
This post is shared for EDUCATIONAL PURPOSES ONLY to study structural breakouts and volume confirmation. It is not financial or investment advice.
🟢 Technical Observations:
1. Channel Breakout: On the weekly timeframe, NELCO has decisively broken out of a multi-month descending channel/wedge pattern.
2. Resistance Flip: The price has cleared a major horizontal resistance zone around 756 - 800. This old resistance is now expected to act as strong structural support on any pullbacks.
3. Volume Surge: The breakout is validated by an exceptional spike in volume (visible at the bottom), showing strong institutional or large-buyer interest.
4. Current Price Action: The stock is currently trading around 871.90, showing strong bullish momentum (+20%+ this week).
🎯 Educational Swing Setup:
• Entry Zone: 800.00 – 871.90 (Ideal entries are closer to the 800-830 support zone if a minor retest occurs, avoiding chasing the immediate peak).
• Immediate Target: 950.00 (Psychological round number and near-term resistance)
• Major Target: 1050.00+ (Looking at previous major swing highs)
• Invalidation / Stop-Loss: 740.00 (A weekly close back inside the channel/below structural support invalidates this breakout setup)
• Expected Duration: 3 to 6 Weeks (Weekly swing view)
⚠️ Risk Management:
Since this is a weekly breakout, volatility can be higher. Always manage your position sizing carefully and wait for candle closures to confirm structural validity.
This post is shared for EDUCATIONAL PURPOSES ONLY to study structural breakouts and volume confirmation. It is not financial or investment advice.
🟢 Technical Observations:
1. Channel Breakout: On the weekly timeframe, NELCO has decisively broken out of a multi-month descending channel/wedge pattern.
2. Resistance Flip: The price has cleared a major horizontal resistance zone around 756 - 800. This old resistance is now expected to act as strong structural support on any pullbacks.
3. Volume Surge: The breakout is validated by an exceptional spike in volume (visible at the bottom), showing strong institutional or large-buyer interest.
4. Current Price Action: The stock is currently trading around 871.90, showing strong bullish momentum (+20%+ this week).
🎯 Educational Swing Setup:
• Entry Zone: 800.00 – 871.90 (Ideal entries are closer to the 800-830 support zone if a minor retest occurs, avoiding chasing the immediate peak).
• Immediate Target: 950.00 (Psychological round number and near-term resistance)
• Major Target: 1050.00+ (Looking at previous major swing highs)
• Invalidation / Stop-Loss: 740.00 (A weekly close back inside the channel/below structural support invalidates this breakout setup)
• Expected Duration: 3 to 6 Weeks (Weekly swing view)
⚠️ Risk Management:
Since this is a weekly breakout, volatility can be higher. Always manage your position sizing carefully and wait for candle closures to confirm structural validity.
Zlecenie aktywne
T1 done
Wyłączenie odpowiedzialności
Informacje i publikacje nie stanowią i nie powinny być traktowane jako porady finansowe, inwestycyjne, tradingowe ani jakiekolwiek inne rekomendacje dostarczane lub zatwierdzone przez TradingView. Więcej informacji znajduje się w Warunkach użytkowania.
Wyłączenie odpowiedzialności
Informacje i publikacje nie stanowią i nie powinny być traktowane jako porady finansowe, inwestycyjne, tradingowe ani jakiekolwiek inne rekomendacje dostarczane lub zatwierdzone przez TradingView. Więcej informacji znajduje się w Warunkach użytkowania.