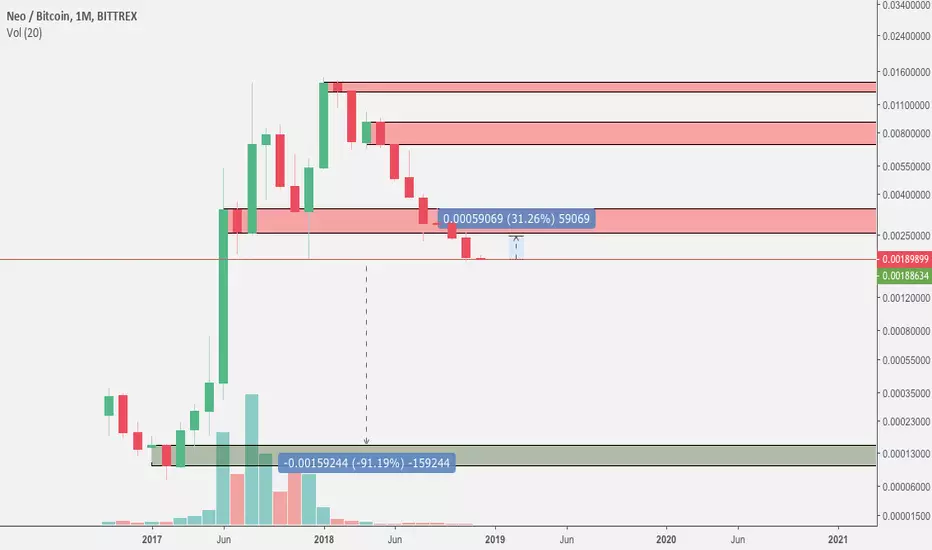
The monthly chart of neobtc looks pretty dangerous, if you're bullish on the NEO project.
Risk averse traders better stay out of NEO at the moment. If you look at weekly/daily levels, you'll see NEO is hanging on the cliff of at least 90% more downwards movements.
However, risk-loving traders might see this as an opportunity. A recovery of NEO might lead to a bounce of 30%. With a tight stop-loss, there are possibilities..
Risk averse traders better stay out of NEO at the moment. If you look at weekly/daily levels, you'll see NEO is hanging on the cliff of at least 90% more downwards movements.
However, risk-loving traders might see this as an opportunity. A recovery of NEO might lead to a bounce of 30%. With a tight stop-loss, there are possibilities..
Anulowano zlecenie
MISSED A SUPPORT LEVEL. NEW CHART POSTED.
Wyłączenie odpowiedzialności
Informacje i publikacje nie stanowią i nie powinny być traktowane jako porady finansowe, inwestycyjne, tradingowe ani jakiekolwiek inne rekomendacje dostarczane lub zatwierdzone przez TradingView. Więcej informacji znajduje się w Warunkach użytkowania.
Wyłączenie odpowiedzialności
Informacje i publikacje nie stanowią i nie powinny być traktowane jako porady finansowe, inwestycyjne, tradingowe ani jakiekolwiek inne rekomendacje dostarczane lub zatwierdzone przez TradingView. Więcej informacji znajduje się w Warunkach użytkowania.