Long
NEOUSD 4h long setup
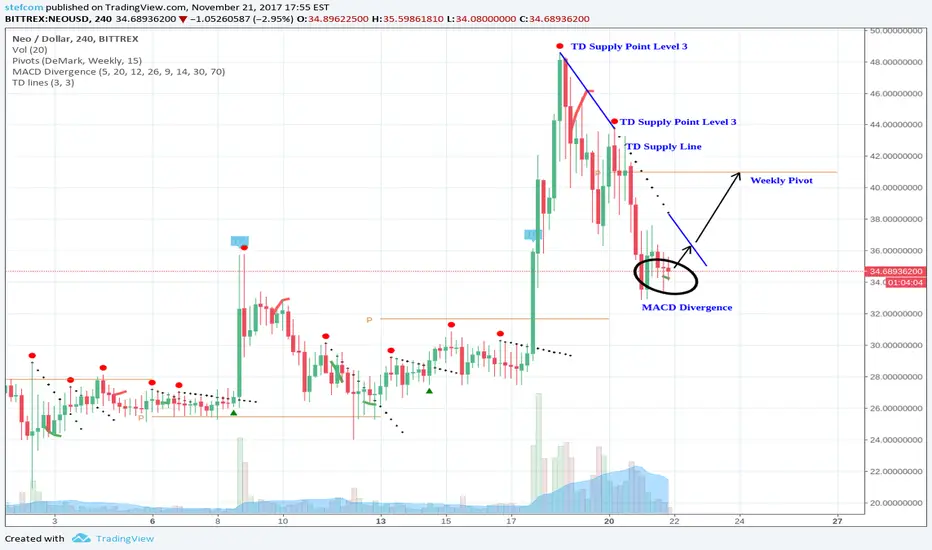
The NEOUSD 4h chart shows a Divergence of Price vs the MACD histogram.
The divergence appeared below a TD Supply Line and could indicate a trend-reversal.
When price breaks the TD Supply Line it could go up to the weekly pivot.
The divergence appeared below a TD Supply Line and could indicate a trend-reversal.
When price breaks the TD Supply Line it could go up to the weekly pivot.

⚡ Signals & Indicator & Strategy & Daily/ Weekly VIP Briefings: tradingclue.com/
⚡ GET THE CCIDivergence INDICATOR FOR FREE: bit.ly/FreeTradingViewIndicator
⚡ FREE Daily Briefings via Telegram: t.me/TradingClueBriefings
⚡ GET THE CCIDivergence INDICATOR FOR FREE: bit.ly/FreeTradingViewIndicator
⚡ FREE Daily Briefings via Telegram: t.me/TradingClueBriefings
Powiązane publikacje
Wyłączenie odpowiedzialności
Informacje i publikacje nie stanowią i nie powinny być traktowane jako porady finansowe, inwestycyjne, tradingowe ani jakiekolwiek inne rekomendacje dostarczane lub zatwierdzone przez TradingView. Więcej informacji znajduje się w Warunkach użytkowania.