
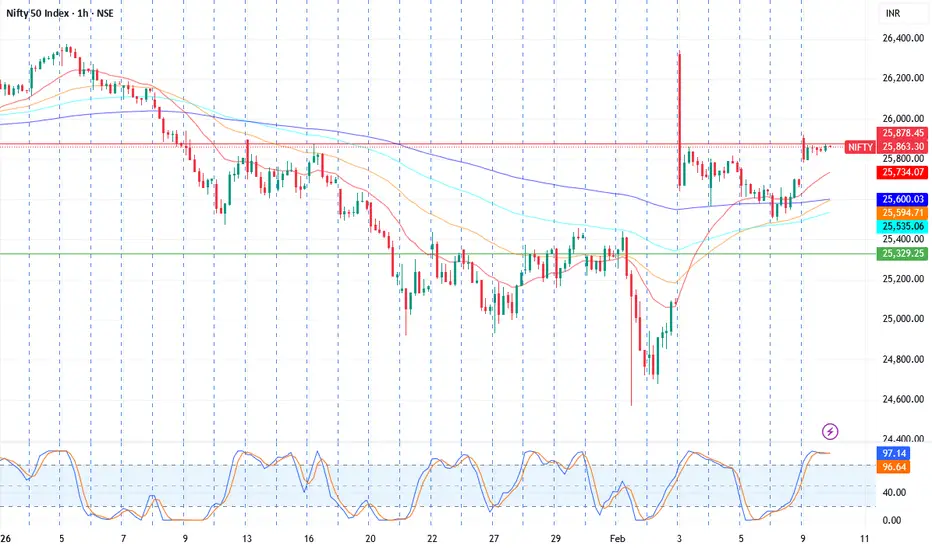
Technical Analysis Report: NIFTY 50 (15m)
1. EMA Trend Analysis
The Nifty 50 opened with a strong gap-up today (approx. +178 points) at 25,888.70, successfully clearing several short-term hurdles.
Current Trend: Bullish. EMAs are moving into a "stacked" ascending order (20>50>100>200).
Key Levels: The price is currently trading above the 200 EMA (approx. 25,650), which acted as a major resistance zone last week but has now flipped to dynamic support.
Crossover Watch: A "Golden Cross" on the 15m chart (20 EMA crossing above the 50 EMA) occurred during the initial morning surge, confirming short-term momentum.
2. StochRSI Analysis
Position: Currently in the Overbought region (≥80).
Signal: The lines are beginning to flatten near the 90–95 level. While the momentum remains strong, the index is "stretched" in the immediate term.
Momentum: Strong upward momentum, but watch for a %K line crossover below the %D line as a signal for a minor intraday cooling period or consolidation.
3. Divergence Detection
Detection: None. Both the price action and StochRSI have made higher highs during the morning session. There is currently no disagreement indicating an immediate reversal.
4. Entry/Exit/Range Logic
Consolidation Range: The index spent most of the midday session consolidating between 25,830 and 25,860.
Support-Resistance Band: * Resistance: 25,922 (Day High) and 26,020 (Psychological Target).
Support: 25,830 (Immediate) and 25,747 (Pivot).
Actionable Insight: Awaiting Confirmation. For fresh Long entries, a decisive close above 25,922 is needed. Current long positions should maintain a trailing stop-loss near the 25,830 mark to protect gains from the gap-up.
1. EMA Trend Analysis
The Nifty 50 opened with a strong gap-up today (approx. +178 points) at 25,888.70, successfully clearing several short-term hurdles.
Current Trend: Bullish. EMAs are moving into a "stacked" ascending order (20>50>100>200).
Key Levels: The price is currently trading above the 200 EMA (approx. 25,650), which acted as a major resistance zone last week but has now flipped to dynamic support.
Crossover Watch: A "Golden Cross" on the 15m chart (20 EMA crossing above the 50 EMA) occurred during the initial morning surge, confirming short-term momentum.
2. StochRSI Analysis
Position: Currently in the Overbought region (≥80).
Signal: The lines are beginning to flatten near the 90–95 level. While the momentum remains strong, the index is "stretched" in the immediate term.
Momentum: Strong upward momentum, but watch for a %K line crossover below the %D line as a signal for a minor intraday cooling period or consolidation.
3. Divergence Detection
Detection: None. Both the price action and StochRSI have made higher highs during the morning session. There is currently no disagreement indicating an immediate reversal.
4. Entry/Exit/Range Logic
Consolidation Range: The index spent most of the midday session consolidating between 25,830 and 25,860.
Support-Resistance Band: * Resistance: 25,922 (Day High) and 26,020 (Psychological Target).
Support: 25,830 (Immediate) and 25,747 (Pivot).
Actionable Insight: Awaiting Confirmation. For fresh Long entries, a decisive close above 25,922 is needed. Current long positions should maintain a trailing stop-loss near the 25,830 mark to protect gains from the gap-up.

Wyłączenie odpowiedzialności
Informacje i publikacje nie stanowią i nie powinny być traktowane jako porady finansowe, inwestycyjne, tradingowe ani jakiekolwiek inne rekomendacje dostarczane lub zatwierdzone przez TradingView. Więcej informacji znajduje się w Warunkach użytkowania.
Wyłączenie odpowiedzialności
Informacje i publikacje nie stanowią i nie powinny być traktowane jako porady finansowe, inwestycyjne, tradingowe ani jakiekolwiek inne rekomendacje dostarczane lub zatwierdzone przez TradingView. Więcej informacji znajduje się w Warunkach użytkowania.