
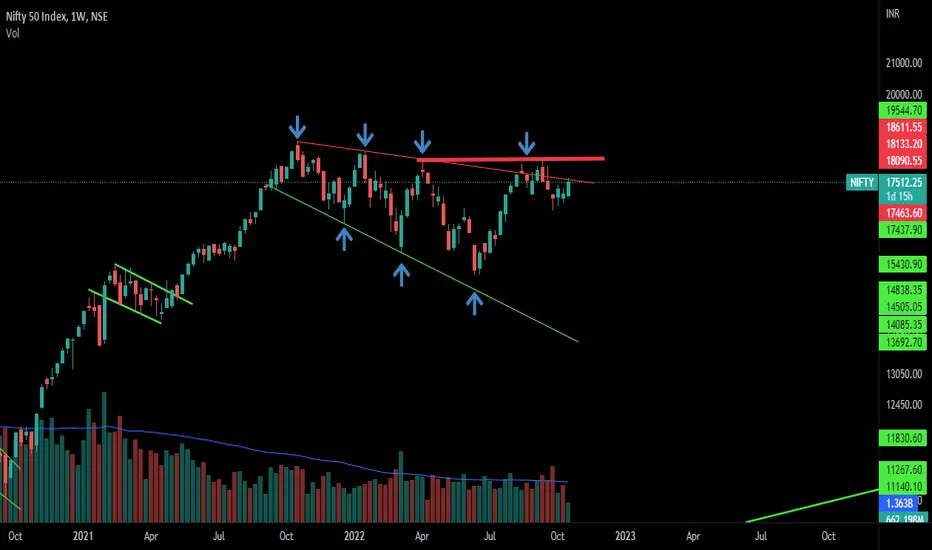
A trendline from the last year's 2021 October highs is where Nifty is facing resistance right now.
Once this is crossed then the immediate resistance will be recent highs which is at 18100.
If it couldn't sustain then Nifty might see 16300 again.
This week's closing candle can give us a clear picture of the upcoming Nifty move.
Watch out for upcoming moves.
Once this is crossed then the immediate resistance will be recent highs which is at 18100.
If it couldn't sustain then Nifty might see 16300 again.
This week's closing candle can give us a clear picture of the upcoming Nifty move.
Watch out for upcoming moves.

GK_Cheerla
Wyłączenie odpowiedzialności
Informacje i publikacje nie stanowią i nie powinny być traktowane jako porady finansowe, inwestycyjne, tradingowe ani jakiekolwiek inne rekomendacje dostarczane lub zatwierdzone przez TradingView. Więcej informacji znajduje się w Warunkach użytkowania.
GK_Cheerla
Wyłączenie odpowiedzialności
Informacje i publikacje nie stanowią i nie powinny być traktowane jako porady finansowe, inwestycyjne, tradingowe ani jakiekolwiek inne rekomendacje dostarczane lub zatwierdzone przez TradingView. Więcej informacji znajduje się w Warunkach użytkowania.