
Key observation: NIFTY has shown strong upward momentum after the BUY signal. Will the index continue towards Target 2, or pause for consolidation? Observe price action around the upcoming reference levels and evaluate the chart against your own trading plan and risk limits.
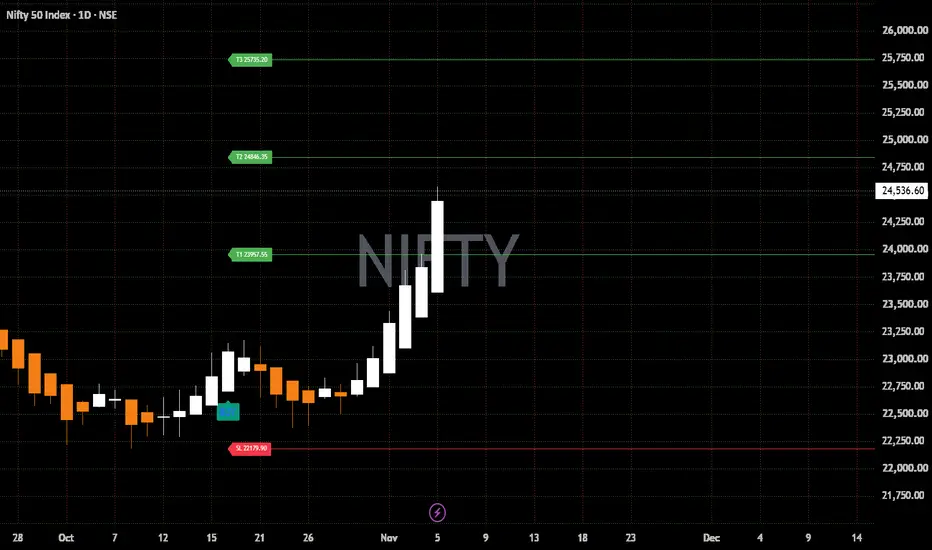
The chart shows a BUY signal, followed by a strong upward price move. Price has moved beyond Target 1 and is now approaching the Target 2 reference zone.
Chart reference levels:
Entry reference: As indicated by the BUY label
Stop-loss level: 22,179.90
Target 1: 23,957.55
Target 2: 24,846.35
Target 3: 25,735.20
These are indicator-generated reference levels for technical analysis, not predictions or guaranteed outcomes. Price may move in either direction, and the setup can fail.
Key observation: NIFTY has shown strong upward momentum after the BUY signal. Will the index continue towards Target 2, or pause for consolidation? Observe price action around the upcoming reference levels and evaluate the chart against your own trading plan and risk limits.
Disclaimer: This post is for educational and informational purposes only. It is not a recommendation to buy, sell, or hold any security or derivative. No returns are assured. Trading involves risk; please do your own research and consult a SEBI-registered investment adviser where appropriate.
The chart shows a BUY signal, followed by a strong upward price move. Price has moved beyond Target 1 and is now approaching the Target 2 reference zone.
Chart reference levels:
Entry reference: As indicated by the BUY label
Stop-loss level: 22,179.90
Target 1: 23,957.55
Target 2: 24,846.35
Target 3: 25,735.20
These are indicator-generated reference levels for technical analysis, not predictions or guaranteed outcomes. Price may move in either direction, and the setup can fail.
Key observation: NIFTY has shown strong upward momentum after the BUY signal. Will the index continue towards Target 2, or pause for consolidation? Observe price action around the upcoming reference levels and evaluate the chart against your own trading plan and risk limits.
Disclaimer: This post is for educational and informational purposes only. It is not a recommendation to buy, sell, or hold any security or derivative. No returns are assured. Trading involves risk; please do your own research and consult a SEBI-registered investment adviser where appropriate.

Powiązane publikacje
Wyłączenie odpowiedzialności
Informacje i publikacje nie stanowią i nie powinny być traktowane jako porady finansowe, inwestycyjne, tradingowe ani jakiekolwiek inne rekomendacje dostarczane lub zatwierdzone przez TradingView. Więcej informacji znajduje się w Warunkach użytkowania.
Powiązane publikacje
Wyłączenie odpowiedzialności
Informacje i publikacje nie stanowią i nie powinny być traktowane jako porady finansowe, inwestycyjne, tradingowe ani jakiekolwiek inne rekomendacje dostarczane lub zatwierdzone przez TradingView. Więcej informacji znajduje się w Warunkach użytkowania.