
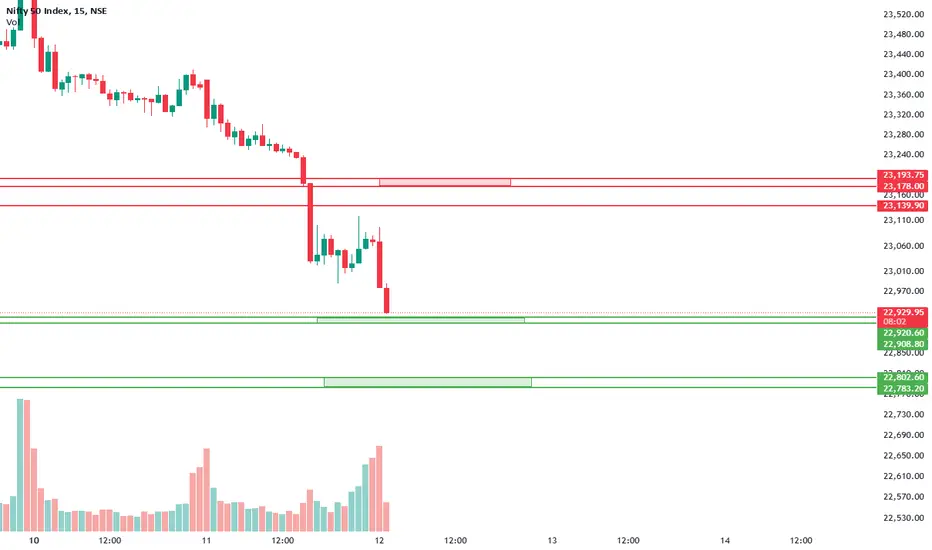
This chart shows support (green levels) and resistance (red levels):
Analysis of the Chart
Resistance Levels (Red)
1 . 23,139.90
2. 23,178.00 - 23,193.75
Support Levels (Green)
The price is currently testing support at around 22,929.95 - 22,920.60.
If this support holds, we may see a bounce back up.
If this level breaks, the price could fall to the next support zone at 22,802.60 - 22,783.20.
Analysis of the Chart
Resistance Levels (Red)
1 . 23,139.90
2. 23,178.00 - 23,193.75
Support Levels (Green)
The price is currently testing support at around 22,929.95 - 22,920.60.
If this support holds, we may see a bounce back up.
If this level breaks, the price could fall to the next support zone at 22,802.60 - 22,783.20.

Wyłączenie odpowiedzialności
Informacje i publikacje nie stanowią i nie powinny być traktowane jako porady finansowe, inwestycyjne, tradingowe ani jakiekolwiek inne rekomendacje dostarczane lub zatwierdzone przez TradingView. Więcej informacji znajduje się w Warunkach użytkowania.
Wyłączenie odpowiedzialności
Informacje i publikacje nie stanowią i nie powinny być traktowane jako porady finansowe, inwestycyjne, tradingowe ani jakiekolwiek inne rekomendacje dostarczane lub zatwierdzone przez TradingView. Więcej informacji znajduje się w Warunkach użytkowania.