
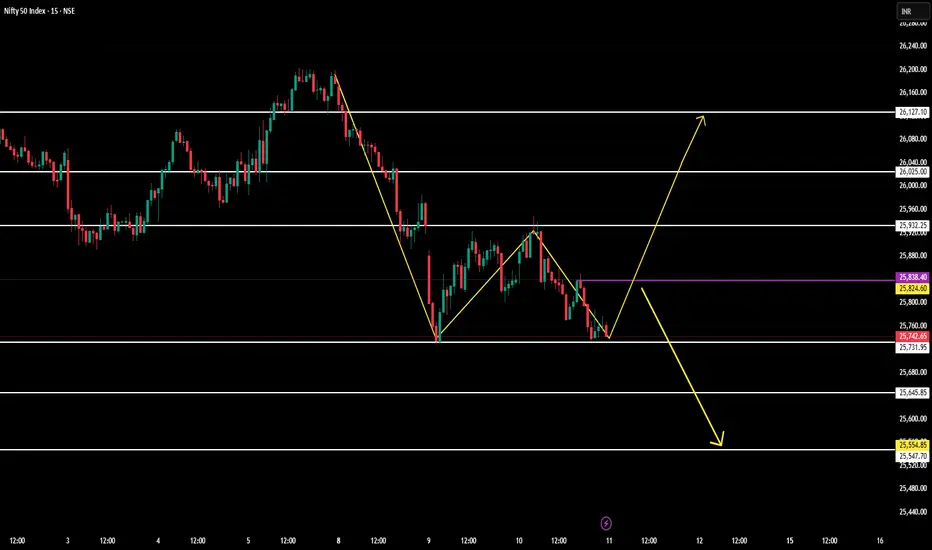
Understand the chart, observe the analysis, implement while trading:
Key Observations:
1. Market Structure and Trend
The chart shows a clear downtrend initially, marked by a strong decline into the support zone around 25,731–25,742.
After the decline, price formed a short-term recovery, creating a lower high and then drifting down again.
This structure indicates bearish pressure, but the current price is sitting at a critical support area where buyers may attempt to react.
2. Support Levels
Major support zones visible on the chart:
25,731–25,742 (current support zone)
This is where price has reacted multiple times.
25,646
25,554
These levels represent demand zones where buyers may step in to prevent further downside.
3. Resistance Levels
Key resistance levels:
25,838–25,825 (purple line region)
This zone is acting as a near-term intraday resistance.
25,932
26,127
These are zones where selling pressure may return if the price moves upward.
4. Current Price Action
The price is currently trading near 25,742, which is an important support zone.
Price has formed a small bounce from this level, indicating early buyer attempts.
However, no strong reversal pattern is confirmed yet.
The yellow projection lines on the chart represent potential bullish or bearish outcomes depending on how price reacts at this support.
Scenarios:
1. Bullish Reversal From Support:
If the price sustains above the 25,731–25,742 support area and forms higher lows:
A recovery toward the 25,825–25,838 resistance is likely.
If this zone breaks, the next upside targets are:
25,932 → 26,025 → 26,127
This indicates buyers gaining momentum from support.
2. Bearish Breakdown:
If the price fails to hold above 25,731–25,742 and a breakdown occurs:
The decline may extend toward lower supports:
25,646 → 25,554
A strong breakdown below these levels suggests continuation of the broader downtrend.
This scenario aligns with the downward yellow arrow shown on your chart.
3. Neutral Sideways Movement:
If price remains within 25,742 to 25,825, a sideways consolidation may form.
This indicates indecision and requires traders to wait for a clean move in either direction.
What This Chart Suggests:
Price is at a decision point.
The current zone is a major support where either a reversal or a breakdown can occur.
Buyers have reacted but have not yet confirmed strength.
Sellers still hold control unless the price breaks above the purple-line resistance zone.
Trading Plan:
For Buyers:
Wait for price to hold above 25,742 and break above the 25,825–25,838 resistance zone.
Upside targets:
25,932 → 26,025 → 26,127
For Sellers:
Look for a clean breakdown below 25,731.
Downside targets:
25,646 → 25,554
For Neutral Traders:
Avoid taking positions in the middle zone
(25,742–25,825)
Wait for rejection at resistance or breakdown at support before entering.
Not SEBI Registered.

Wyłączenie odpowiedzialności
Informacje i publikacje nie stanowią i nie powinny być traktowane jako porady finansowe, inwestycyjne, tradingowe ani jakiekolwiek inne rekomendacje dostarczane lub zatwierdzone przez TradingView. Więcej informacji znajduje się w Warunkach użytkowania.
Wyłączenie odpowiedzialności
Informacje i publikacje nie stanowią i nie powinny być traktowane jako porady finansowe, inwestycyjne, tradingowe ani jakiekolwiek inne rekomendacje dostarczane lub zatwierdzone przez TradingView. Więcej informacji znajduje się w Warunkach użytkowania.