
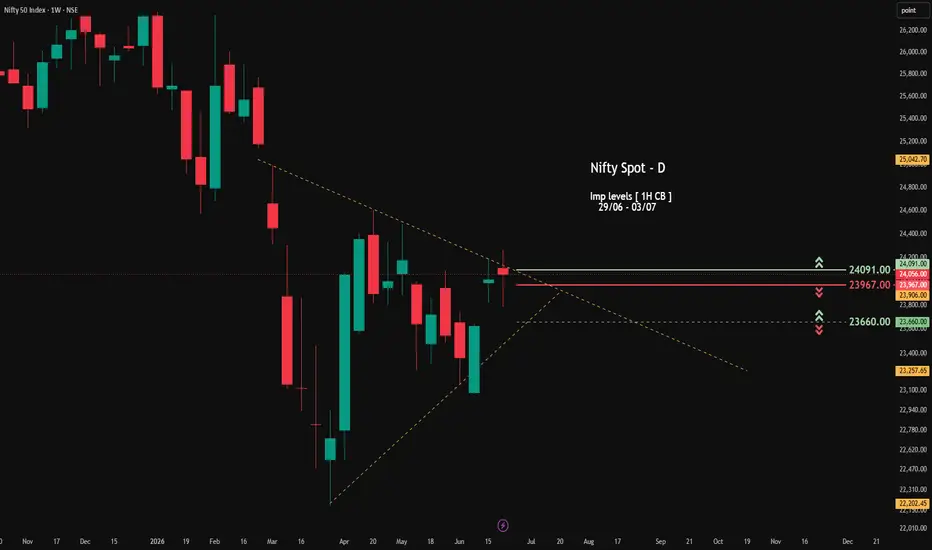
the Nifty 50 Index on the weekly (1W) timeframe is currently coiled within a distinct symmetrical triangle formation, bounded by converging dotted orange trendlines. When analyzing the momentum over the last 7 trading sessions—which spans the aggressive bullishness of the preceding week and the consolidation of the current week—the price action reveals a critical standoff between buyers and sellers near the pattern's apex.
The index saw a forceful upward thrust that brought it directly into resistance territory, currently hovering around the 24,056.00 mark. This recent surge has transitioned into a tight consolidation phase, represented by the current small-bodied candle, indicating that the market is taking a breather and building energy for its next directional move.
Upside Resistance: 24,091.00 (Marked by the green level and arrows)
Immediate Support: 23,967.00 (Marked by the red solid line)
Deeper Structural Support: 23,660.00 (Marked by the lower red level and arrows)
The convergence of the trendlines suggests an imminent breakout. A sustained push and close above the 24,091.00 resistance would validate the recent bullish momentum and likely trigger an upward breakout from the triangle. Conversely, if the index fails to clear this ceiling and slips below the 23,967.00, it opens the door for a retracement toward the lower boundary of the triangle and the deeper support zone at 23,660.00.
The index saw a forceful upward thrust that brought it directly into resistance territory, currently hovering around the 24,056.00 mark. This recent surge has transitioned into a tight consolidation phase, represented by the current small-bodied candle, indicating that the market is taking a breather and building energy for its next directional move.
Upside Resistance: 24,091.00 (Marked by the green level and arrows)
Immediate Support: 23,967.00 (Marked by the red solid line)
Deeper Structural Support: 23,660.00 (Marked by the lower red level and arrows)
The convergence of the trendlines suggests an imminent breakout. A sustained push and close above the 24,091.00 resistance would validate the recent bullish momentum and likely trigger an upward breakout from the triangle. Conversely, if the index fails to clear this ceiling and slips below the 23,967.00, it opens the door for a retracement toward the lower boundary of the triangle and the deeper support zone at 23,660.00.

Powiązane publikacje
Wyłączenie odpowiedzialności
Informacje i publikacje nie stanowią i nie powinny być traktowane jako porady finansowe, inwestycyjne, tradingowe ani jakiekolwiek inne rekomendacje dostarczane lub zatwierdzone przez TradingView. Więcej informacji znajduje się w Warunkach użytkowania.
Powiązane publikacje
Wyłączenie odpowiedzialności
Informacje i publikacje nie stanowią i nie powinny być traktowane jako porady finansowe, inwestycyjne, tradingowe ani jakiekolwiek inne rekomendacje dostarczane lub zatwierdzone przez TradingView. Więcej informacji znajduje się w Warunkach użytkowania.