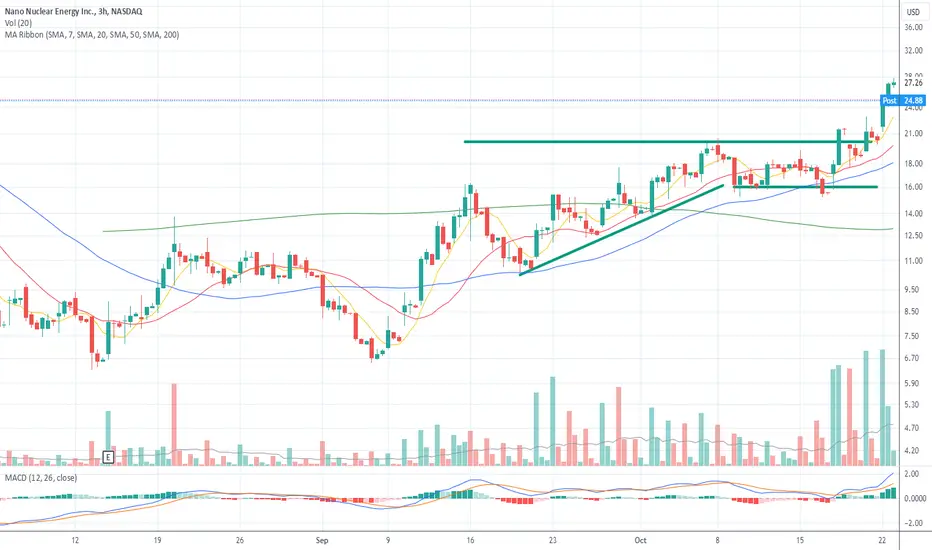
 NNE Graph illustration in practice:
It's not very clean when there is high volatility, but the principle remains the same.
First bullish leg of more than 30% (here +100%), higher lows, volatility contraction, price riding the moving averages (-> the Fork Toto), formation of a tight base -> pattern like RDM or VCP 🔥🔥
The difference between a pattern that works and one that doesn't lies in what fuels it.
We observe this with a change in volume behavior: large buyer volumes and low seller volumes.
In this case, the fuel is investors' interest in new AI technology.

Wyłączenie odpowiedzialności
Informacje i publikacje nie stanowią i nie powinny być traktowane jako porady finansowe, inwestycyjne, tradingowe ani jakiekolwiek inne rekomendacje dostarczane lub zatwierdzone przez TradingView. Więcej informacji znajduje się w Warunkach użytkowania.
Wyłączenie odpowiedzialności
Informacje i publikacje nie stanowią i nie powinny być traktowane jako porady finansowe, inwestycyjne, tradingowe ani jakiekolwiek inne rekomendacje dostarczane lub zatwierdzone przez TradingView. Więcej informacji znajduje się w Warunkach użytkowania.