
📊 Friday Market Recap & Analysis

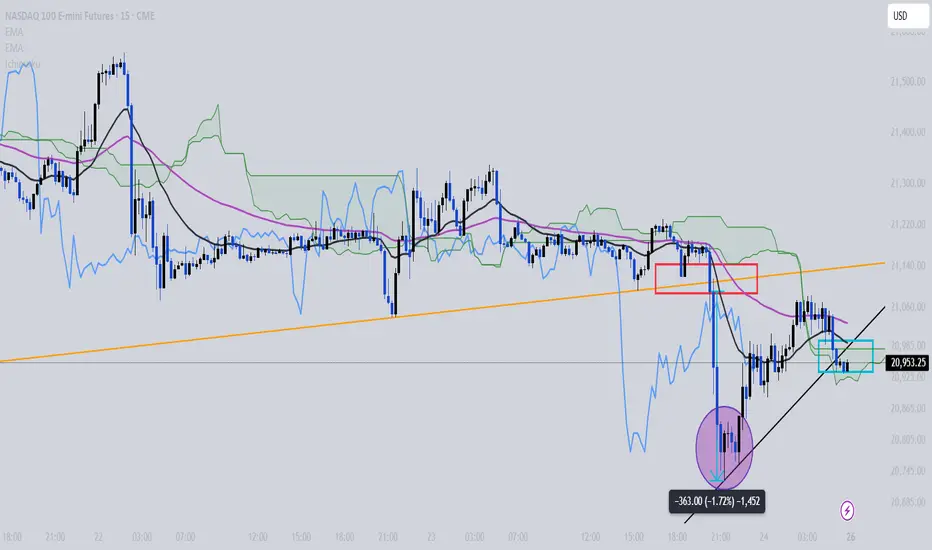
As previously mentioned, the trend had shifted downward, and I advised against taking long positions—short bias only.
Although the uptrend line was broken twice, one break was a fakeout and the price pulled back up.
Eventually, the red box support zone was broken, and the target was hit with a max drop of $363, resulting in a profit of around $7,260 per contract.
A rebound occurred as the US market opened, but a short-term trendline break at the close suggests Monday's market may lean downward—unless strong positive news emerges over the weekend.
🕰 Weekly Chart View (NASDAQ)

The weekly candle closed just slightly above the previous high, but not significantly—likely meaningless.
The 20-week MA is currently at 20,272.
If the NASDAQ breaks the recent low, there’s a high chance it could drop down to the 20-week MA + top of the Ichimoku Cloud.
📅 Daily Chart View (NASDAQ)

Buying pressure hasn’t fully disappeared yet—NASDAQ is still sitting above the 20-day MA, meaning the trend could revive.
However, if the 20-day MA (around 20,647) is broken, the price may fall into the orange box supply zone.
Historically, we’ve seen a box range movement between 20,400–19,300, so a break of the 20-day MA could lead to a repeat.
For long re-entry, the purple box zone (19,300–18,980) is a strong support area to watch.
✅ Conclusion
・Unless major news comes out over the weekend, Monday’s market will likely retest the 20-day MA.
・If that level breaks, the next drop could be around $1,000, which is significant.
・As always—wait patiently and take the trade when the market gives it to you.
As previously mentioned, the trend had shifted downward, and I advised against taking long positions—short bias only.
Although the uptrend line was broken twice, one break was a fakeout and the price pulled back up.
Eventually, the red box support zone was broken, and the target was hit with a max drop of $363, resulting in a profit of around $7,260 per contract.
A rebound occurred as the US market opened, but a short-term trendline break at the close suggests Monday's market may lean downward—unless strong positive news emerges over the weekend.
🕰 Weekly Chart View (NASDAQ)
The weekly candle closed just slightly above the previous high, but not significantly—likely meaningless.
The 20-week MA is currently at 20,272.
If the NASDAQ breaks the recent low, there’s a high chance it could drop down to the 20-week MA + top of the Ichimoku Cloud.
📅 Daily Chart View (NASDAQ)
Buying pressure hasn’t fully disappeared yet—NASDAQ is still sitting above the 20-day MA, meaning the trend could revive.
However, if the 20-day MA (around 20,647) is broken, the price may fall into the orange box supply zone.
Historically, we’ve seen a box range movement between 20,400–19,300, so a break of the 20-day MA could lead to a repeat.
For long re-entry, the purple box zone (19,300–18,980) is a strong support area to watch.
✅ Conclusion
・Unless major news comes out over the weekend, Monday’s market will likely retest the 20-day MA.
・If that level breaks, the next drop could be around $1,000, which is significant.
・As always—wait patiently and take the trade when the market gives it to you.

Powiązane publikacje
Wyłączenie odpowiedzialności
Informacje i publikacje nie stanowią i nie powinny być traktowane jako porady finansowe, inwestycyjne, tradingowe ani jakiekolwiek inne rekomendacje dostarczane lub zatwierdzone przez TradingView. Więcej informacji znajduje się w Warunkach użytkowania.
Powiązane publikacje
Wyłączenie odpowiedzialności
Informacje i publikacje nie stanowią i nie powinny być traktowane jako porady finansowe, inwestycyjne, tradingowe ani jakiekolwiek inne rekomendacje dostarczane lub zatwierdzone przez TradingView. Więcej informacji znajduje się w Warunkach użytkowania.