Technical Analysis
Earnings-Per-Share and Revenue Growth Between 2025 & 2028
Health
Insiders
Action
Targets into 2028
- The stock price for Insperity
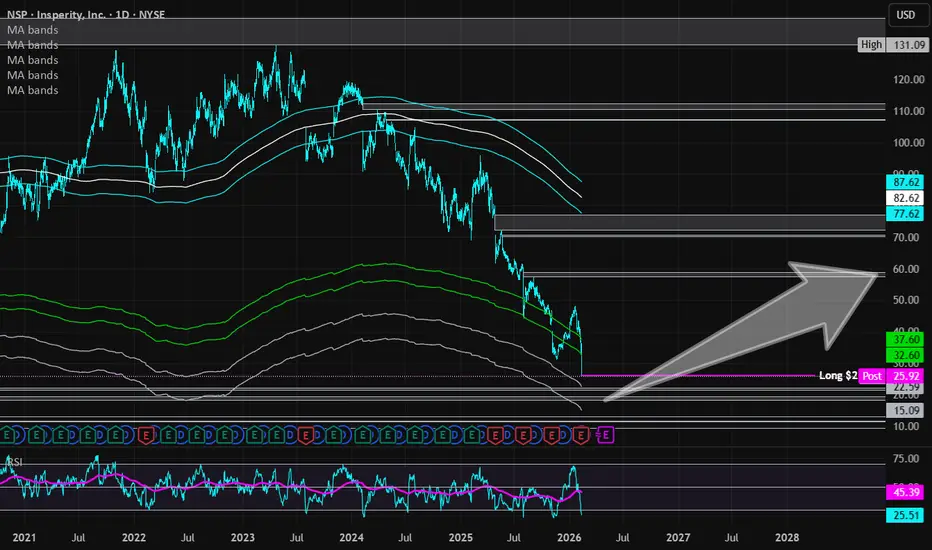
 NSP has fallen below my "crash" simple moving average zone (green lines). A continued decline into the "major crash" zone (gray lines) is highly likely (currently between $15-$22). These often areas of algorithmic share accumulation and can signal a bottom - but it doesn't mean a trickle down won't happen. I believe recovery will be after 2026, so patience for investors is necessary for this one.
Earnings-Per-Share and Revenue Growth Between 2025 & 2028
- Projected Earnings-Per-Share Growth: +280.6% (from $1.03 in 2025 to $3.92 in 2028)
- Projected Revenue Growth: +17.6% (from $6.8 billion in 2025 to $9 billion in 2028)
Health
- Debt-to-Equity: 9.9x (high debt)
- Altman's Z-Score/Bankruptcy Risk: 3.9 (healthy / low risk)
- Quick Ratio/Ability to pay current bills: 1.1 (okay, but ideally between 1.5 and 3)
Insiders
- Mostly buying: openinsider.com/NSP
Action
- I do believe more downside is ahead. There is a high probability of a continued decline into my "major crash" historical moving average area - potentially even down to $15 (watch out for dividend cut to trigger said level). The debt-to-equity is high, but it is otherwise a low bankruptcy risk. If this company can weather 2026, I believe there could be significant upside. Thus, at $26.00, NSP is in a personal buy zone with further entries planned between $15.00 and $18.00.
Targets into 2028
- $34.00 (+30.8%)
- $47.00 (+80.8%)
Zlecenie aktywne
Target #1 reached resulting in a +30.8% gain.Transakcja zamknięta: osiągnięto wyznaczony cel
Target #2 reached resulting in an +80.8% gain. Trade closed.
If you enjoy this idea, please follow for more: tradingview.com/u/WorthlessViews/
Wyłączenie odpowiedzialności
Informacje i publikacje nie stanowią i nie powinny być traktowane jako porady finansowe, inwestycyjne, tradingowe ani jakiekolwiek inne rekomendacje dostarczane lub zatwierdzone przez TradingView. Więcej informacji znajduje się w Warunkach użytkowania.
If you enjoy this idea, please follow for more: tradingview.com/u/WorthlessViews/
Wyłączenie odpowiedzialności
Informacje i publikacje nie stanowią i nie powinny być traktowane jako porady finansowe, inwestycyjne, tradingowe ani jakiekolwiek inne rekomendacje dostarczane lub zatwierdzone przez TradingView. Więcej informacji znajduje się w Warunkach użytkowania.