
NVIDIA has just delivered a sharp upward move after a prolonged period of intraday weakness. But here is the big question: Is this the beginning of a fresh bullish leg, or are buyers about to run into a wall of selling pressure?
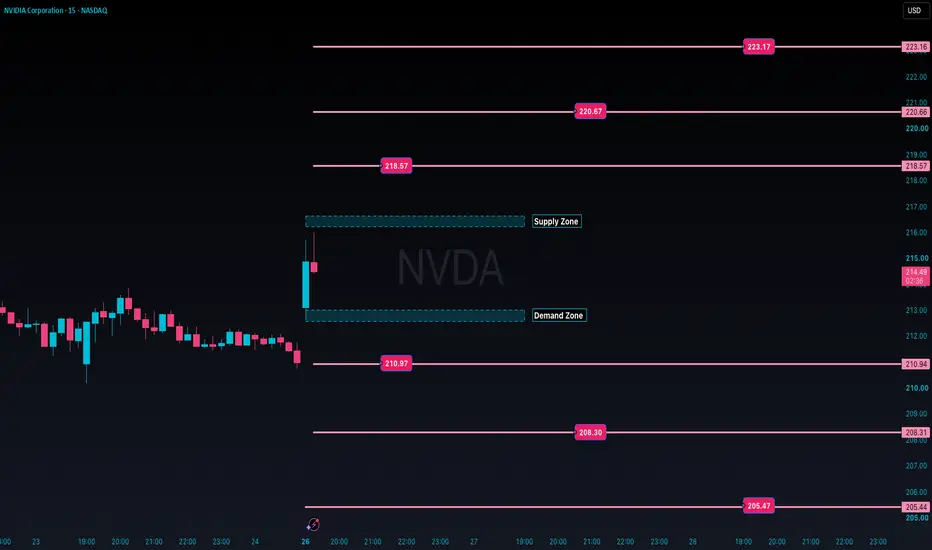
NVDA is trading around $215.31 on the 15-minute chart, approaching a key supply zone that could determine its next move.
Let's decode the levels that matter.
The Battle Zone: $216.25–$216.65
This is the immediate supply zone to watch. How price behaves here could reveal whether buyers have enough strength to continue the recovery.
Scenario 1: The Bullish Breakout
If NVDA closes decisively above $216.65 and holds the breakout on a retest, buyers could attempt to push toward:
$218.57
$220.66
$223.16
The key is sustained buying pressure, not just a brief spike above resistance.
Scenario 2: The Bearish Rejection
If sellers defend the supply zone and price begins forming a lower high, the rally could lose momentum.
Watch these potential downside reference levels:
$213.00–$212.65 — Immediate demand zone
$210.94 — First major support
$208.31 — Next support
$205.44 — Lower support
A confirmed breakdown of nearby support would strengthen the bearish scenario. Until then, rejection alone does not guarantee a decline.
The Levels That Could Define the Trade
Above $216.65: Watch for bullish continuation.
Below $212.65: Watch for renewed selling pressure.
Between $212.65 and $216.65: Expect the possibility of consolidation, false breakouts and choppy price action.
The disciplined approach is to wait for confirmation, define the invalidation level and assess the potential reward against the risk before entering.
The Real Question: What Happens Next?
NVIDIA has momentum, but momentum alone does not confirm a trend reversal. The next reaction around supply could be more important than the rally that brought price here.
Are we witnessing the start of another move higher, or is this simply a relief rally before sellers return?
Join the discussion:
A — BREAKOUT: NVDA clears $216.65 and targets higher resistance.
B — PULLBACK: Sellers defend supply and price retreats toward demand.
C — WAIT: No trade until price confirms its direction.
Comment A, B or C and tell us which price level would confirm your view. We want to hear your reasoning, not just your prediction.
Follow Globus Capitas for more NVIDIA stock analysis, US stock market insights, technical analysis and actionable chart-reading education.
Read the Chart. Respect the Levels. Trade with Discipline.
Educational analysis based on the supplied NVDA 15-minute chart dated October 26, 2026. Levels are reference points, not guaranteed targets or personalised investment advice. Verify current prices before trading. Trading involves risk.
NVDA is trading around $215.31 on the 15-minute chart, approaching a key supply zone that could determine its next move.
Let's decode the levels that matter.
The Battle Zone: $216.25–$216.65
This is the immediate supply zone to watch. How price behaves here could reveal whether buyers have enough strength to continue the recovery.
Scenario 1: The Bullish Breakout
If NVDA closes decisively above $216.65 and holds the breakout on a retest, buyers could attempt to push toward:
$218.57
$220.66
$223.16
The key is sustained buying pressure, not just a brief spike above resistance.
Scenario 2: The Bearish Rejection
If sellers defend the supply zone and price begins forming a lower high, the rally could lose momentum.
Watch these potential downside reference levels:
$213.00–$212.65 — Immediate demand zone
$210.94 — First major support
$208.31 — Next support
$205.44 — Lower support
A confirmed breakdown of nearby support would strengthen the bearish scenario. Until then, rejection alone does not guarantee a decline.
The Levels That Could Define the Trade
Above $216.65: Watch for bullish continuation.
Below $212.65: Watch for renewed selling pressure.
Between $212.65 and $216.65: Expect the possibility of consolidation, false breakouts and choppy price action.
The disciplined approach is to wait for confirmation, define the invalidation level and assess the potential reward against the risk before entering.
The Real Question: What Happens Next?
NVIDIA has momentum, but momentum alone does not confirm a trend reversal. The next reaction around supply could be more important than the rally that brought price here.
Are we witnessing the start of another move higher, or is this simply a relief rally before sellers return?
Join the discussion:
A — BREAKOUT: NVDA clears $216.65 and targets higher resistance.
B — PULLBACK: Sellers defend supply and price retreats toward demand.
C — WAIT: No trade until price confirms its direction.
Comment A, B or C and tell us which price level would confirm your view. We want to hear your reasoning, not just your prediction.
Follow Globus Capitas for more NVIDIA stock analysis, US stock market insights, technical analysis and actionable chart-reading education.
Read the Chart. Respect the Levels. Trade with Discipline.
Educational analysis based on the supplied NVDA 15-minute chart dated October 26, 2026. Levels are reference points, not guaranteed targets or personalised investment advice. Verify current prices before trading. Trading involves risk.
Uwaga

Wyłączenie odpowiedzialności
Informacje i publikacje nie stanowią i nie powinny być traktowane jako porady finansowe, inwestycyjne, tradingowe ani jakiekolwiek inne rekomendacje dostarczane lub zatwierdzone przez TradingView. Więcej informacji znajduje się w Warunkach użytkowania.
Wyłączenie odpowiedzialności
Informacje i publikacje nie stanowią i nie powinny być traktowane jako porady finansowe, inwestycyjne, tradingowe ani jakiekolwiek inne rekomendacje dostarczane lub zatwierdzone przez TradingView. Więcej informacji znajduje się w Warunkach użytkowania.