
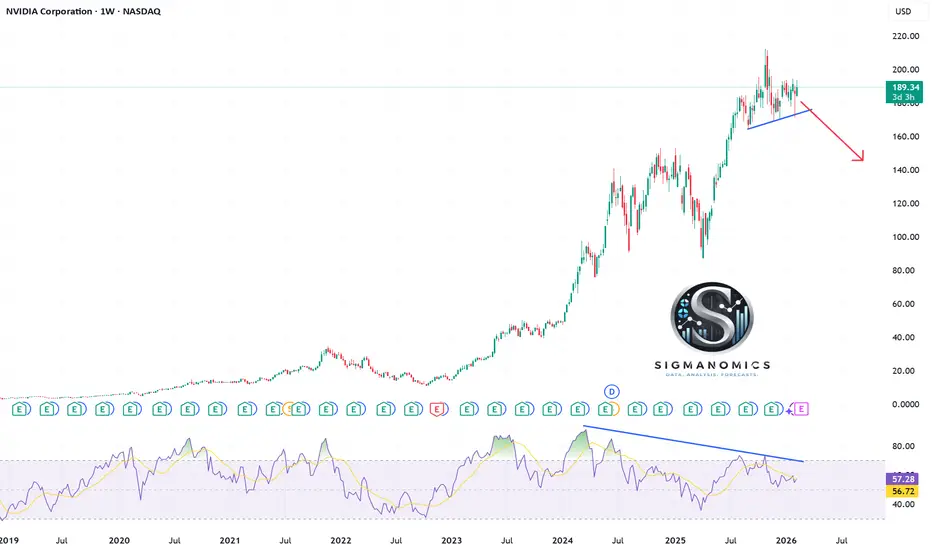
For those afraid of heights, Nvidia price action is warning of a correction in the medium term. To date, price action is holding above weekly trend line support at 176; however, a break below could expose a deeper pullback into the 150-140 zone, with the viewpoint supported by bearish RSI divergence that has developed since 2024. Meanwhile, there is a daily head and shoulders forming, with bears looking for confirmation on a break and close below support.

📊 Data. Analysis. Forecasts.
Cut through the noise → sigmanomics.com
📅 Never miss a market mover
Economic Calendar → sigmanomics.com/economic-calendar
🎯 Stop guessing. Start forecasting.
sigmanomics.com/forecasts
Cut through the noise → sigmanomics.com
📅 Never miss a market mover
Economic Calendar → sigmanomics.com/economic-calendar
🎯 Stop guessing. Start forecasting.
sigmanomics.com/forecasts
Wyłączenie odpowiedzialności
Informacje i publikacje nie stanowią i nie powinny być traktowane jako porady finansowe, inwestycyjne, tradingowe ani jakiekolwiek inne rekomendacje dostarczane lub zatwierdzone przez TradingView. Więcej informacji znajduje się w Warunkach użytkowania.
📊 Data. Analysis. Forecasts.
Cut through the noise → sigmanomics.com
📅 Never miss a market mover
Economic Calendar → sigmanomics.com/economic-calendar
🎯 Stop guessing. Start forecasting.
sigmanomics.com/forecasts
Cut through the noise → sigmanomics.com
📅 Never miss a market mover
Economic Calendar → sigmanomics.com/economic-calendar
🎯 Stop guessing. Start forecasting.
sigmanomics.com/forecasts
Wyłączenie odpowiedzialności
Informacje i publikacje nie stanowią i nie powinny być traktowane jako porady finansowe, inwestycyjne, tradingowe ani jakiekolwiek inne rekomendacje dostarczane lub zatwierdzone przez TradingView. Więcej informacji znajduje się w Warunkach użytkowania.