
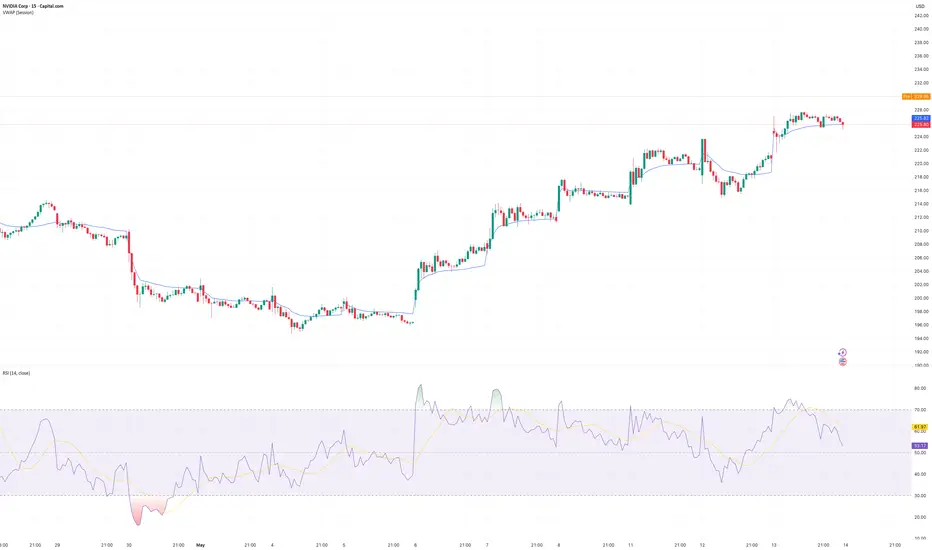
The opening hour is often where the tone for the trading day is established. Overnight positioning adjusts, institutional liquidity enters the market, and traders begin revealing whether early momentum is likely to be accepted or faded.
For intraday traders working with liquid stocks on the five-minute chart, Volume Weighted Average Price (VWAP) can become a highly effective reference point during this process. Not as a standalone signal, but as a framework for understanding whether buyers or sellers are maintaining control during the opening phase of the session.
Why the opening hour matters
The first hour of trade is often less about prediction and more about discovery.
Markets are digesting overnight news, reacting to earnings, repricing sentiment, and establishing where liquidity is prepared to transact. This is particularly important in highly liquid US stocks, where aggressive opening moves can often shape positioning for the rest of the session.
That is why experienced intraday traders pay close attention to how price behaves during this phase. A strong opening move that immediately fades can tell a very different story to one that is accepted and built upon.
This is where VWAP becomes useful.
VWAP as a framework, not a signal
VWAP acts as a rolling reference point for average traded price throughout the session. Because it incorporates both price and volume, it is widely monitored by institutional participants and active intraday traders alike.
However, the real edge does not come from blindly buying above VWAP or selling below it.
The more important information comes from how price behaves around it during the opening phase of the day.
For example:
• Strong openings that continue holding above VWAP often suggest buyers are maintaining control.
• Weak opens that repeatedly fail beneath VWAP can signal persistent selling pressure.
• Failed reclaims of VWAP often provide information about momentum exhaustion.
• Choppy interaction around VWAP can point towards a rotational, range-bound session.
VWAP works best when combined with structure and price action, not isolated from it.
A bullish example
In this Coinbase example, the stock initially gaps lower at the open, creating the impression of weakness. However, rather than accelerating lower, price quickly stabilises and begins holding above VWAP during the opening phase of the session.
That shift in behaviour is important.
Despite the negative open, sellers struggle to maintain control beneath VWAP, while pullbacks begin finding support above it. As the session develops, momentum gradually shifts in favour of the buyers, with the stock eventually trending higher into the close.
The opening gap created emotion. The more important information came from how price behaved relative to VWAP during the first hour of trading.
COIN 5-Min Candle Chart

Past performance is not a reliable indicator of future results
A bearish example
In this Bank of America example, price breaks below the prior day’s low during the opening phase of the session and quickly loses VWAP.
That weakness then begins reinforcing itself.
Attempts to stabilise beneath VWAP fail, rallies become increasingly shallow, and price continues respecting VWAP as dynamic resistance throughout the day. Rather than reclaiming the opening breakdown, the market accepts lower prices and intraday momentum remains firmly with the sellers.
Again, the key information was not simply the break itself, but how price behaved relative to VWAP during the first hour of trade.
BAC 5-Min Candle Chart

Past performance is not a reliable indicator of future results
The nuance matters
VWAP should not be viewed as a predictive tool. There will be sessions where price moves aggressively away from it before completely reversing later in the day. There will also be highly rotational sessions where price repeatedly crosses above and below VWAP without establishing clear directional control.
That is why context matters.
The opening hour should be viewed as a process of information gathering rather than an attempt to predict every move. VWAP simply helps frame whether momentum is being accepted, rejected, or fading as the session develops.
For intraday traders, that can provide a valuable bias heading into the rest of the day.
Bringing it together
Many traders focus heavily on the opening move itself. In reality, the more important information often comes from what happens next.
Does price hold above VWAP after the open?
Do sellers regain control beneath it?
Are pullbacks being bought or sold?
Is momentum expanding or fading?
The opening move creates the narrative. VWAP can help confirm whether the market is accepting it.
Disclaimer: This is for information and learning purposes only. The information provided does not constitute investment advice nor take into account the individual financial circumstances or objectives of any investor. Any information that may be provided relating to past performance is not a reliable indicator of future results or performance. Social media channels are not relevant for UK residents.
Spread bets and CFDs are complex instruments and come with a high risk of losing money rapidly due to leverage. 78.48% of retail investor accounts lose money when trading spread bets and CFDs with this provider. You should consider whether you understand how spread bets and CFDs work and whether you can afford to take the high risk of losing your money.
For intraday traders working with liquid stocks on the five-minute chart, Volume Weighted Average Price (VWAP) can become a highly effective reference point during this process. Not as a standalone signal, but as a framework for understanding whether buyers or sellers are maintaining control during the opening phase of the session.
Why the opening hour matters
The first hour of trade is often less about prediction and more about discovery.
Markets are digesting overnight news, reacting to earnings, repricing sentiment, and establishing where liquidity is prepared to transact. This is particularly important in highly liquid US stocks, where aggressive opening moves can often shape positioning for the rest of the session.
That is why experienced intraday traders pay close attention to how price behaves during this phase. A strong opening move that immediately fades can tell a very different story to one that is accepted and built upon.
This is where VWAP becomes useful.
VWAP as a framework, not a signal
VWAP acts as a rolling reference point for average traded price throughout the session. Because it incorporates both price and volume, it is widely monitored by institutional participants and active intraday traders alike.
However, the real edge does not come from blindly buying above VWAP or selling below it.
The more important information comes from how price behaves around it during the opening phase of the day.
For example:
• Strong openings that continue holding above VWAP often suggest buyers are maintaining control.
• Weak opens that repeatedly fail beneath VWAP can signal persistent selling pressure.
• Failed reclaims of VWAP often provide information about momentum exhaustion.
• Choppy interaction around VWAP can point towards a rotational, range-bound session.
VWAP works best when combined with structure and price action, not isolated from it.
A bullish example
In this Coinbase example, the stock initially gaps lower at the open, creating the impression of weakness. However, rather than accelerating lower, price quickly stabilises and begins holding above VWAP during the opening phase of the session.
That shift in behaviour is important.
Despite the negative open, sellers struggle to maintain control beneath VWAP, while pullbacks begin finding support above it. As the session develops, momentum gradually shifts in favour of the buyers, with the stock eventually trending higher into the close.
The opening gap created emotion. The more important information came from how price behaved relative to VWAP during the first hour of trading.
COIN 5-Min Candle Chart
Past performance is not a reliable indicator of future results
A bearish example
In this Bank of America example, price breaks below the prior day’s low during the opening phase of the session and quickly loses VWAP.
That weakness then begins reinforcing itself.
Attempts to stabilise beneath VWAP fail, rallies become increasingly shallow, and price continues respecting VWAP as dynamic resistance throughout the day. Rather than reclaiming the opening breakdown, the market accepts lower prices and intraday momentum remains firmly with the sellers.
Again, the key information was not simply the break itself, but how price behaved relative to VWAP during the first hour of trade.
BAC 5-Min Candle Chart
Past performance is not a reliable indicator of future results
The nuance matters
VWAP should not be viewed as a predictive tool. There will be sessions where price moves aggressively away from it before completely reversing later in the day. There will also be highly rotational sessions where price repeatedly crosses above and below VWAP without establishing clear directional control.
That is why context matters.
The opening hour should be viewed as a process of information gathering rather than an attempt to predict every move. VWAP simply helps frame whether momentum is being accepted, rejected, or fading as the session develops.
For intraday traders, that can provide a valuable bias heading into the rest of the day.
Bringing it together
Many traders focus heavily on the opening move itself. In reality, the more important information often comes from what happens next.
Does price hold above VWAP after the open?
Do sellers regain control beneath it?
Are pullbacks being bought or sold?
Is momentum expanding or fading?
The opening move creates the narrative. VWAP can help confirm whether the market is accepting it.
Disclaimer: This is for information and learning purposes only. The information provided does not constitute investment advice nor take into account the individual financial circumstances or objectives of any investor. Any information that may be provided relating to past performance is not a reliable indicator of future results or performance. Social media channels are not relevant for UK residents.
Spread bets and CFDs are complex instruments and come with a high risk of losing money rapidly due to leverage. 78.48% of retail investor accounts lose money when trading spread bets and CFDs with this provider. You should consider whether you understand how spread bets and CFDs work and whether you can afford to take the high risk of losing your money.

Wyłączenie odpowiedzialności
Informacje i publikacje nie stanowią i nie powinny być traktowane jako porady finansowe, inwestycyjne, tradingowe ani jakiekolwiek inne rekomendacje dostarczane lub zatwierdzone przez TradingView. Więcej informacji znajduje się w Warunkach użytkowania.
Wyłączenie odpowiedzialności
Informacje i publikacje nie stanowią i nie powinny być traktowane jako porady finansowe, inwestycyjne, tradingowe ani jakiekolwiek inne rekomendacje dostarczane lub zatwierdzone przez TradingView. Więcej informacji znajduje się w Warunkach użytkowania.