Long
OAS Long
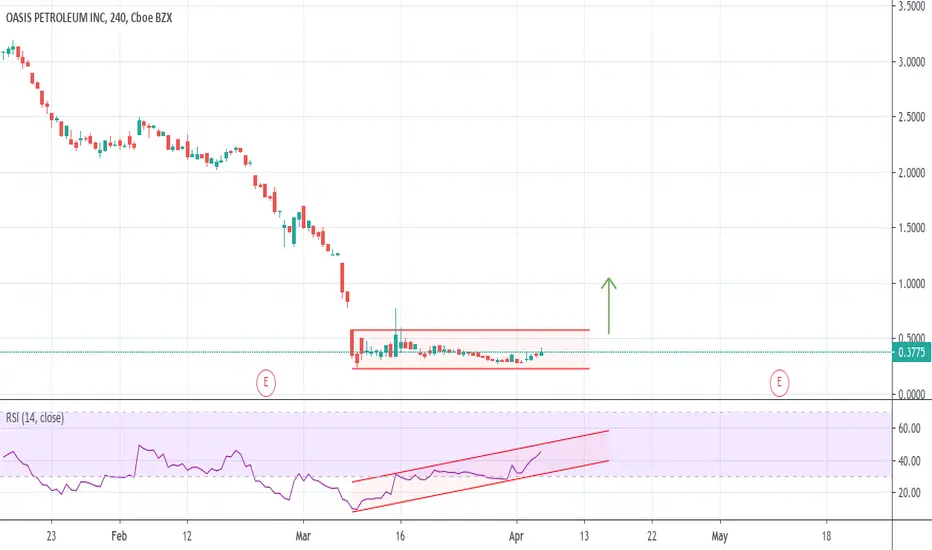
Oasis Petroleum was one of the hardest hit producers following the collapse of oil. As oil begins to recover and OPEC+ agree on productions cuts, we will see OAS begin to climb back.
As the RSI chart indicates, the price has oscillated in a tight range. However, the RSI has begun to diverge and move upward indicating a bullish bias. The stock as at all times lows. Oil is not going away any time soon. Safe to accumulate long positions here in my opinion.
Best of luck trading!
As the RSI chart indicates, the price has oscillated in a tight range. However, the RSI has begun to diverge and move upward indicating a bullish bias. The stock as at all times lows. Oil is not going away any time soon. Safe to accumulate long positions here in my opinion.
Best of luck trading!

Wyłączenie odpowiedzialności
Informacje i publikacje nie stanowią i nie powinny być traktowane jako porady finansowe, inwestycyjne, tradingowe ani jakiekolwiek inne rekomendacje dostarczane lub zatwierdzone przez TradingView. Więcej informacji znajduje się w Warunkach użytkowania.
Wyłączenie odpowiedzialności
Informacje i publikacje nie stanowią i nie powinny być traktowane jako porady finansowe, inwestycyjne, tradingowe ani jakiekolwiek inne rekomendacje dostarczane lub zatwierdzone przez TradingView. Więcej informacji znajduje się w Warunkach użytkowania.