
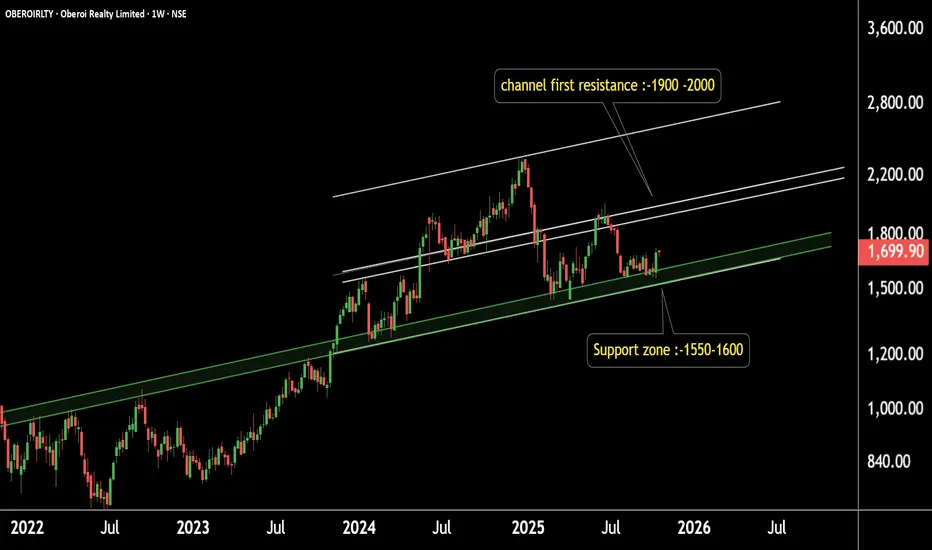
Oberoi Realty – Daily Timeframe Analysis
Oberoi Realty is currently trading near a strong long-term support zone in the ₹1,500–₹1,600 range.
Timeframe: Daily
Support Zone: ₹1,500–₹1,600
Resistance (Channel Mid-Boundary): ₹1,900–₹2,000
Structure: The stock is moving within a well-defined parallel channel, respecting its trend boundaries over time.
If the support zone holds, a potential upside towards the upper channel levels can be expected — indicating possible bullish momentum ahead.
Thank you!
Oberoi Realty is currently trading near a strong long-term support zone in the ₹1,500–₹1,600 range.
Timeframe: Daily
Support Zone: ₹1,500–₹1,600
Resistance (Channel Mid-Boundary): ₹1,900–₹2,000
Structure: The stock is moving within a well-defined parallel channel, respecting its trend boundaries over time.
If the support zone holds, a potential upside towards the upper channel levels can be expected — indicating possible bullish momentum ahead.
Thank you!

@RahulSarawagi
Connect us at optionlab.co.in/
Connect us at optionlab.co.in/
Wyłączenie odpowiedzialności
Informacje i publikacje nie stanowią i nie powinny być traktowane jako porady finansowe, inwestycyjne, tradingowe ani jakiekolwiek inne rekomendacje dostarczane lub zatwierdzone przez TradingView. Więcej informacji znajduje się w Warunkach użytkowania.
@RahulSarawagi
Connect us at optionlab.co.in/
Connect us at optionlab.co.in/
Wyłączenie odpowiedzialności
Informacje i publikacje nie stanowią i nie powinny być traktowane jako porady finansowe, inwestycyjne, tradingowe ani jakiekolwiek inne rekomendacje dostarczane lub zatwierdzone przez TradingView. Więcej informacji znajduje się w Warunkach użytkowania.