
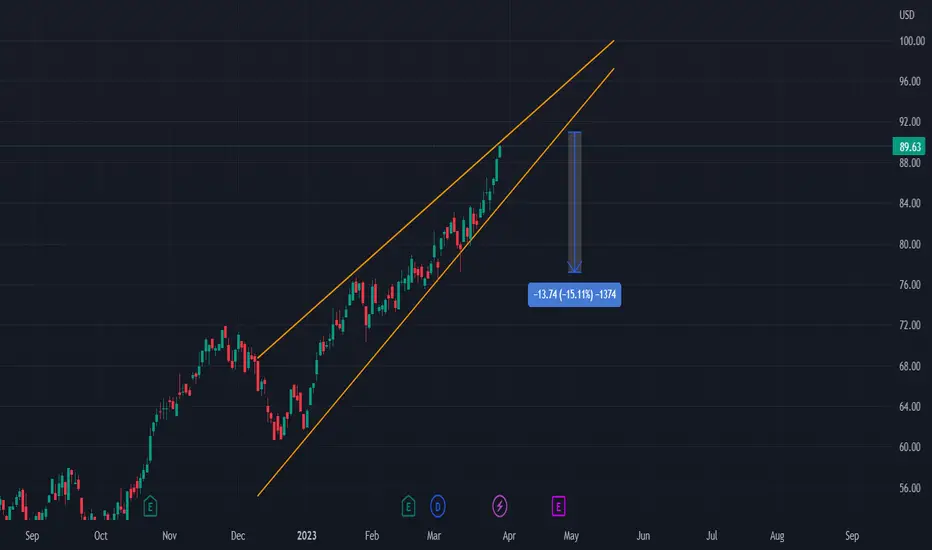
On the chart, we can see a rising wedge occurring.
OMAB is at its 52-week high, and this has been formed as a rising wedge.
We therefore expect it to have a drop to the downside.
Entry will be at the breakout of the wedge with a possible ROI of 15%
More details are shown on the chart.
OMAB is at its 52-week high, and this has been formed as a rising wedge.
We therefore expect it to have a drop to the downside.
Entry will be at the breakout of the wedge with a possible ROI of 15%
More details are shown on the chart.
Transakcja zamknięta: osiągnięto wyznaczony cel
Played out as expected. Closing here as target reached almost.Uwaga
Next Short may be entered on the retest of the upsloping resistance (previous support)Uwaga
have bounced
💥 Free signals and ideas ➡ t.me/vfinvestment
Powiązane publikacje
Wyłączenie odpowiedzialności
Informacje i publikacje nie stanowią i nie powinny być traktowane jako porady finansowe, inwestycyjne, tradingowe ani jakiekolwiek inne rekomendacje dostarczane lub zatwierdzone przez TradingView. Więcej informacji znajduje się w Warunkach użytkowania.
💥 Free signals and ideas ➡ t.me/vfinvestment
Powiązane publikacje
Wyłączenie odpowiedzialności
Informacje i publikacje nie stanowią i nie powinny być traktowane jako porady finansowe, inwestycyjne, tradingowe ani jakiekolwiek inne rekomendacje dostarczane lub zatwierdzone przez TradingView. Więcej informacji znajduje się w Warunkach użytkowania.