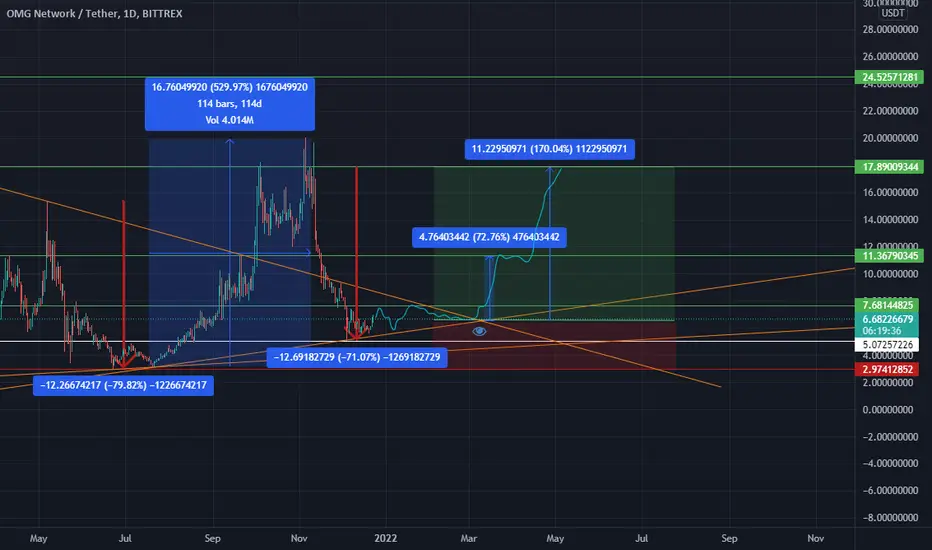
As you can see using the daily chart, the previous bear markets have crashed around 70% each time, highlighted with a RED price range arrow. We have now reached the 70% bear market, so previous history tells us we're on our way back up! We may see a slight dip during the holiday, but have faith we will rise.
The brushed line shows a possible scenario that could happen following previous trendlines.
Remember to set SL and TP along the way, feel free to use resistance as guidance!
The brushed line shows a possible scenario that could happen following previous trendlines.
Remember to set SL and TP along the way, feel free to use resistance as guidance!

Wyłączenie odpowiedzialności
Informacje i publikacje nie stanowią i nie powinny być traktowane jako porady finansowe, inwestycyjne, tradingowe ani jakiekolwiek inne rekomendacje dostarczane lub zatwierdzone przez TradingView. Więcej informacji znajduje się w Warunkach użytkowania.
Wyłączenie odpowiedzialności
Informacje i publikacje nie stanowią i nie powinny być traktowane jako porady finansowe, inwestycyjne, tradingowe ani jakiekolwiek inne rekomendacje dostarczane lub zatwierdzone przez TradingView. Więcej informacji znajduje się w Warunkach użytkowania.