
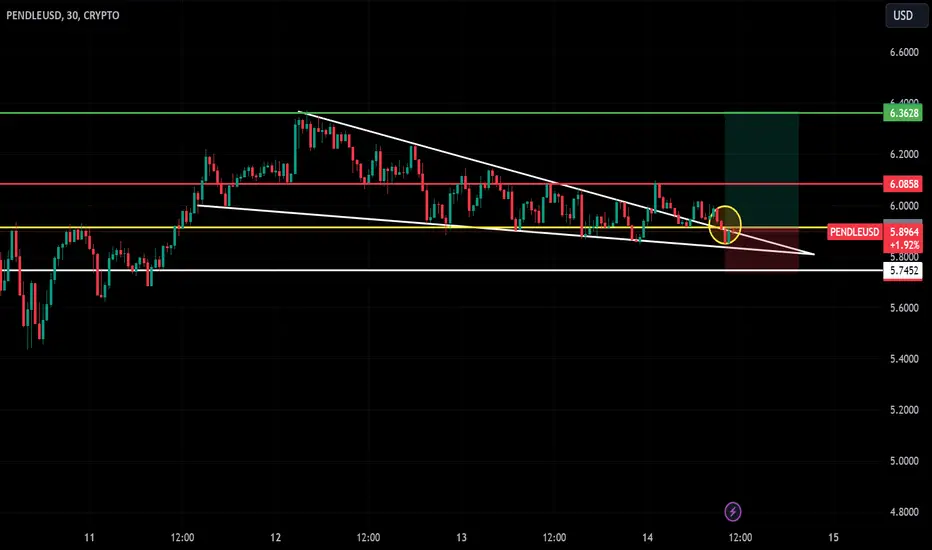
The PENDLEUSD chart shows a descending triangle breakout on the 30-minute timeframe. Key levels to watch:
Entry Point: Near the breakout zone, confirming bullish momentum.
Stop Loss: Set below the triangle support at 5.7452 for risk management.
Take Profit: Targeting 6.3628, aligning with the next resistance level.
This setup features a strong risk-to-reward ratio, ideal for capitalizing on a potential trend reversal. Monitor closely for confirmation of upward movement.
Entry Point: Near the breakout zone, confirming bullish momentum.
Stop Loss: Set below the triangle support at 5.7452 for risk management.
Take Profit: Targeting 6.3628, aligning with the next resistance level.
This setup features a strong risk-to-reward ratio, ideal for capitalizing on a potential trend reversal. Monitor closely for confirmation of upward movement.

Wyłączenie odpowiedzialności
Informacje i publikacje nie stanowią i nie powinny być traktowane jako porady finansowe, inwestycyjne, tradingowe ani jakiekolwiek inne rekomendacje dostarczane lub zatwierdzone przez TradingView. Więcej informacji znajduje się w Warunkach użytkowania.
Wyłączenie odpowiedzialności
Informacje i publikacje nie stanowią i nie powinny być traktowane jako porady finansowe, inwestycyjne, tradingowe ani jakiekolwiek inne rekomendacje dostarczane lub zatwierdzone przez TradingView. Więcej informacji znajduje się w Warunkach użytkowania.