
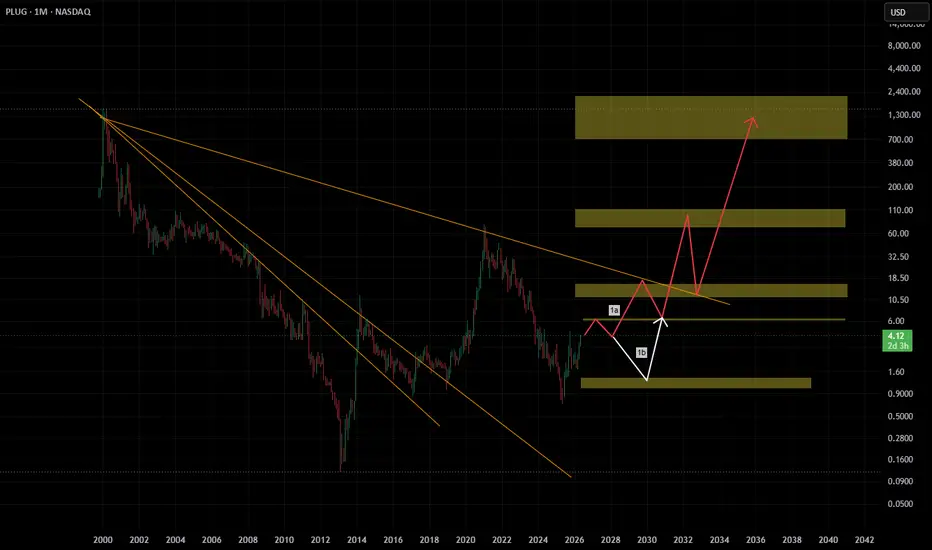
PLUG - Monthly : The Long Reset
Some charts do not move in straight lines.
They move through cycles of destruction, accumulation, and repricing.
PLUG spent years inside a macro downtrend, bleeding from the euphoric highs while continuously printing lower highs and lower lows. But structure is beginning to shift.
The chart now shows early signs of a potential long-term transition phase.
Two scenarios are mapped.
Scenario 1a: Price holds above the current strong low, reclaims structural resistance, and begins building a sustainable recovery sequence. Slow at first. Volatile throughout. But structurally constructive.
Scenario 1b: The market performs one final sweep into macro support before the real expansion begins. Maximum pain. Maximum pessimism. The type of move designed to convince participants the asset is dead before repricing starts.
Both paths eventually target the same higher timeframe zones:
first the weak high region, then the macro expansion range above.
The key difference is whether the market needs one more capitulation event before acceptance returns.
Monthly charts reward patience.
Not noise.
EQC tracks structure, liquidity, and behavioral cycles.
The market reveals its intentions long before the headlines do.
Hidden in plain sight. EQC.
Follow, Boost, Thank You!
Warning: Financial Disclaimer: This post is not financial advice. I am not your financial advisor, your hydrogen engineer, or your emotional support during drawdowns. Always do your own research and never trade solely based on arrows and internet conviction.
Some charts do not move in straight lines.
They move through cycles of destruction, accumulation, and repricing.
PLUG spent years inside a macro downtrend, bleeding from the euphoric highs while continuously printing lower highs and lower lows. But structure is beginning to shift.
The chart now shows early signs of a potential long-term transition phase.
Two scenarios are mapped.
Scenario 1a: Price holds above the current strong low, reclaims structural resistance, and begins building a sustainable recovery sequence. Slow at first. Volatile throughout. But structurally constructive.
Scenario 1b: The market performs one final sweep into macro support before the real expansion begins. Maximum pain. Maximum pessimism. The type of move designed to convince participants the asset is dead before repricing starts.
Both paths eventually target the same higher timeframe zones:
first the weak high region, then the macro expansion range above.
The key difference is whether the market needs one more capitulation event before acceptance returns.
Monthly charts reward patience.
Not noise.
EQC tracks structure, liquidity, and behavioral cycles.
The market reveals its intentions long before the headlines do.
Hidden in plain sight. EQC.
Follow, Boost, Thank You!
Warning: Financial Disclaimer: This post is not financial advice. I am not your financial advisor, your hydrogen engineer, or your emotional support during drawdowns. Always do your own research and never trade solely based on arrows and internet conviction.

Wyłączenie odpowiedzialności
Informacje i publikacje nie stanowią i nie powinny być traktowane jako porady finansowe, inwestycyjne, tradingowe ani jakiekolwiek inne rekomendacje dostarczane lub zatwierdzone przez TradingView. Więcej informacji znajduje się w Warunkach użytkowania.
Wyłączenie odpowiedzialności
Informacje i publikacje nie stanowią i nie powinny być traktowane jako porady finansowe, inwestycyjne, tradingowe ani jakiekolwiek inne rekomendacje dostarczane lub zatwierdzone przez TradingView. Więcej informacji znajduje się w Warunkach użytkowania.