 POLYCAB
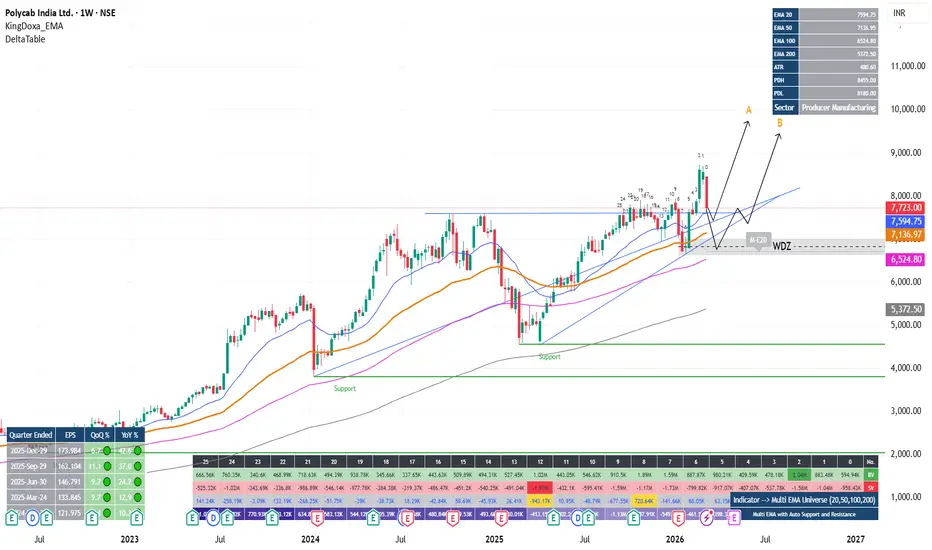
 - Weekly chart represent the strength of the stock.
- On Weekly, stock above all major EMA validating its strength.
- Nice Weekly demand zone is available around 7K which showed its strength of breakout.
- Price currently returned to re-test breakout area.
- On Daily, Price below EMA20 and near to EMA50 represent the pullback not a seller dominance.
- Two major trendline support is also available to hold or return the price.
- Two probable setups available as shown in chart.
NB: Not a Registered Advisor. Many time I failed with my setups. Do take advise from your financial advisor prior trade. Here I am just sharing my views to community, not advising to anybody for buy or sell.
Zlecenie aktywne
Price exactly follows our assumptions, reach to marked weekly area as per "B" and shown clear reaction on daily chart. Made it more hopeful now.
Uwaga
Plan B is working good, Holding it tight.Uwaga
How many catch that opportunity ?Uwaga
Shifted SL to safe guard the profit. Risk free + surety of closing only in profit.Transakcja zamknięta: osiągnięto wyznaczony cel
Closed with 1: 5 Risk Reward ... Target achieved.

Wyłączenie odpowiedzialności
Informacje i publikacje nie stanowią i nie powinny być traktowane jako porady finansowe, inwestycyjne, tradingowe ani jakiekolwiek inne rekomendacje dostarczane lub zatwierdzone przez TradingView. Więcej informacji znajduje się w Warunkach użytkowania.
Wyłączenie odpowiedzialności
Informacje i publikacje nie stanowią i nie powinny być traktowane jako porady finansowe, inwestycyjne, tradingowe ani jakiekolwiek inne rekomendacje dostarczane lub zatwierdzone przez TradingView. Więcej informacji znajduje się w Warunkach użytkowania.