
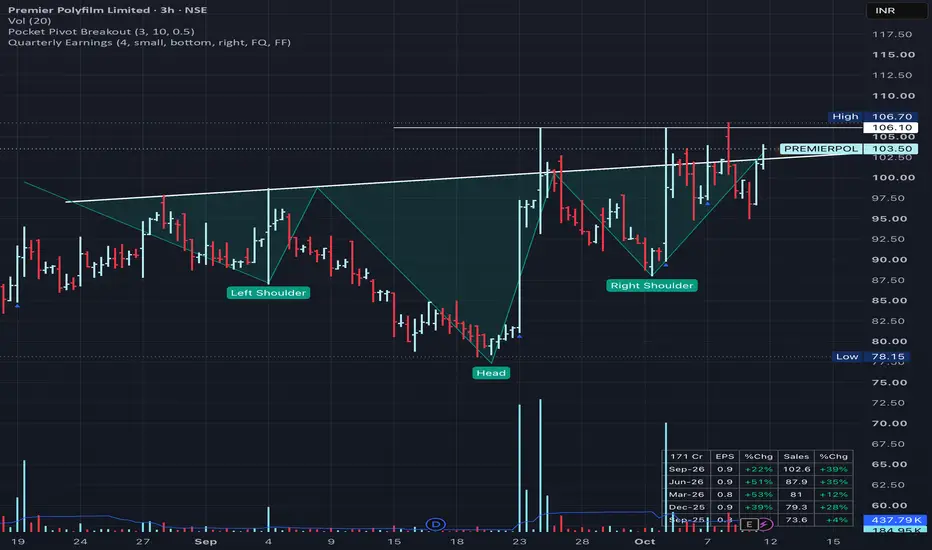
Premier Polyfilm (NSE: PREMIERPOL) has built a clean inverse head & shoulders on the 3H chart over the last ~6 weeks, and price is now trading right at the breakout zone, with fresh Q2 results backing the move.
📐 Structure
Left shoulder: ~87 (early Sep)
Head: 78.15 (Sep 21–22)
Right shoulder: ~88 (Oct 1), a higher low than the left shoulder
Neckline: rising, currently around 102–102.5
Horizontal supply: 106.10–106.70. It has been rejected 3 times (Sep 24, Oct 2, Oct 9).
Price closed the week at 103.50, above the sloping neckline but still below horizontal resistance. The true breakout is a close above 106.70.
📊 Volume
The strongest volume bars came off the head (Sep 23–24) and on the right-shoulder reversal (Oct 2). Demand is showing up on the way up. The latest bar is below the 20-period average (185K vs 438K), so I want to see expansion on the breakout before committing fully.
📈 Fundamentals: Q2FY27 Results 👍
Revenue: ₹115.06 Cr, up 38.3% YoY and 15% QoQ
EBITDA: ₹14.53 Cr, up 18.2% YoY and 7.5% QoQ
PAT: ₹9.81 Cr, up 24.5% YoY and 10% QoQ
H1FY27: revenue up 36.5%, PAT up 34.8% YoY
Growth is strong and consistent, with this being the 5th straight quarter of YoY sales growth. The one soft spot is margins. EBITDA margin fell to 12.63% from 14.78% YoY, so profit is growing slower than revenue. That’s worth watching next quarter, but it doesn’t break the story.
🎯 Trade Plan
Aggressive entry: 102.5–104 (on the neckline reclaim)
Confirmed entry: 3H/daily close above 106.70 on above-average volume
Stop loss: 94.50 (below the Oct 10 swing low)
Target 1: 115
Target 2: 124–125. This is the measured move: pattern depth of ~22 projected from the neckline.
Invalidation: a close back below 99 (under the neckline) negates the pattern.
Not investment advice. Do your own research and size positions accordingly.
Tags: PREMIERPOL, inverseheadandshoulders, breakout, chartpattern, NSE, smallcap, Q2FY27
📐 Structure
Left shoulder: ~87 (early Sep)
Head: 78.15 (Sep 21–22)
Right shoulder: ~88 (Oct 1), a higher low than the left shoulder
Neckline: rising, currently around 102–102.5
Horizontal supply: 106.10–106.70. It has been rejected 3 times (Sep 24, Oct 2, Oct 9).
Price closed the week at 103.50, above the sloping neckline but still below horizontal resistance. The true breakout is a close above 106.70.
📊 Volume
The strongest volume bars came off the head (Sep 23–24) and on the right-shoulder reversal (Oct 2). Demand is showing up on the way up. The latest bar is below the 20-period average (185K vs 438K), so I want to see expansion on the breakout before committing fully.
📈 Fundamentals: Q2FY27 Results 👍
Revenue: ₹115.06 Cr, up 38.3% YoY and 15% QoQ
EBITDA: ₹14.53 Cr, up 18.2% YoY and 7.5% QoQ
PAT: ₹9.81 Cr, up 24.5% YoY and 10% QoQ
H1FY27: revenue up 36.5%, PAT up 34.8% YoY
Growth is strong and consistent, with this being the 5th straight quarter of YoY sales growth. The one soft spot is margins. EBITDA margin fell to 12.63% from 14.78% YoY, so profit is growing slower than revenue. That’s worth watching next quarter, but it doesn’t break the story.
🎯 Trade Plan
Aggressive entry: 102.5–104 (on the neckline reclaim)
Confirmed entry: 3H/daily close above 106.70 on above-average volume
Stop loss: 94.50 (below the Oct 10 swing low)
Target 1: 115
Target 2: 124–125. This is the measured move: pattern depth of ~22 projected from the neckline.
Invalidation: a close back below 99 (under the neckline) negates the pattern.
Not investment advice. Do your own research and size positions accordingly.
Tags: PREMIERPOL, inverseheadandshoulders, breakout, chartpattern, NSE, smallcap, Q2FY27

Wyłączenie odpowiedzialności
Informacje i publikacje nie stanowią i nie powinny być traktowane jako porady finansowe, inwestycyjne, tradingowe ani jakiekolwiek inne rekomendacje dostarczane lub zatwierdzone przez TradingView. Więcej informacji znajduje się w Warunkach użytkowania.
Wyłączenie odpowiedzialności
Informacje i publikacje nie stanowią i nie powinny być traktowane jako porady finansowe, inwestycyjne, tradingowe ani jakiekolwiek inne rekomendacje dostarczane lub zatwierdzone przez TradingView. Więcej informacji znajduje się w Warunkach użytkowania.