
StockDaDa Verdict
🟢 8.5/10 Setup
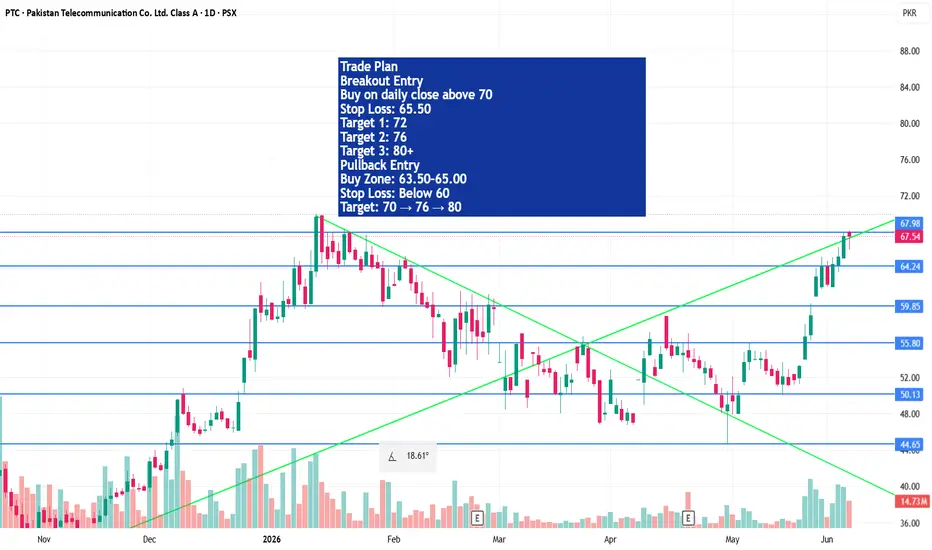
PTC is very close to a major breakout. A daily close above 70 can open the path toward 76–80 in the coming weeks.
🟢 Bullish Breakout in Progress
PTC has staged an impressive recovery from the 47–48 zone and is now testing a major resistance area around 68–70, which was the previous swing high zone.
Market Structure
✅ Higher Highs & Higher Lows established
✅ Strong momentum candles during the recent rally
✅ Volume expansion confirms institutional participation
✅ Price has reclaimed all major short-term resistance levels
Key Levels
Resistance
R1: 68.50–70.00 (major breakout zone)
R2: 72.00
R3: 76.00–78.00
Support
S1: 63.50–64.00
S2: 60.00
S3: 56.00 (trend invalidation area)
🟢 8.5/10 Setup
PTC is very close to a major breakout. A daily close above 70 can open the path toward 76–80 in the coming weeks.
🟢 Bullish Breakout in Progress
PTC has staged an impressive recovery from the 47–48 zone and is now testing a major resistance area around 68–70, which was the previous swing high zone.
Market Structure
✅ Higher Highs & Higher Lows established
✅ Strong momentum candles during the recent rally
✅ Volume expansion confirms institutional participation
✅ Price has reclaimed all major short-term resistance levels
Key Levels
Resistance
R1: 68.50–70.00 (major breakout zone)
R2: 72.00
R3: 76.00–78.00
Support
S1: 63.50–64.00
S2: 60.00
S3: 56.00 (trend invalidation area)

⚠️ Disclaimer:
This analysis is for educational purposes only and is not financial advice.
This analysis is for educational purposes only and is not financial advice.
Wyłączenie odpowiedzialności
Informacje i publikacje nie stanowią i nie powinny być traktowane jako porady finansowe, inwestycyjne, tradingowe ani jakiekolwiek inne rekomendacje dostarczane lub zatwierdzone przez TradingView. Więcej informacji znajduje się w Warunkach użytkowania.
⚠️ Disclaimer:
This analysis is for educational purposes only and is not financial advice.
This analysis is for educational purposes only and is not financial advice.
Wyłączenie odpowiedzialności
Informacje i publikacje nie stanowią i nie powinny być traktowane jako porady finansowe, inwestycyjne, tradingowe ani jakiekolwiek inne rekomendacje dostarczane lub zatwierdzone przez TradingView. Więcej informacji znajduje się w Warunkach użytkowania.