
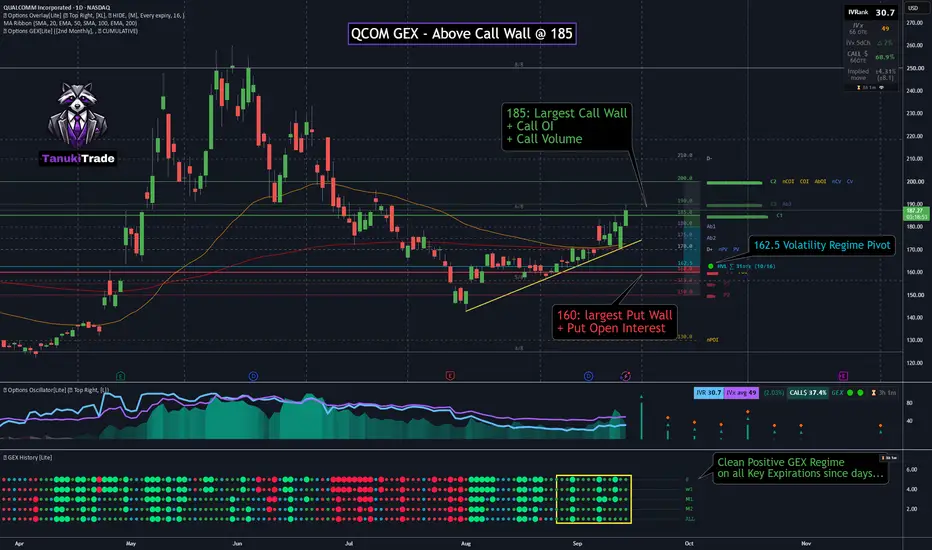
QCOM is extending its daily recovery after establishing a sequence of higher lows from the August low.
At 187.71, price remains above 180—the start of the call cluster—and above the 185 C3 wall. The immediate test is now the strengthened 190 reaction zone, only 2.29 points above spot.
The dominant 200 call wall remains the larger upside decision point. Until 200 is cleared and accepted, QCOM has not entered the positive extension zone.
🔶 Regime Context 🔶
Price remains well above the 162.5 HVL, maintaining a positive GEX regime. The positive net gamma concentration has strengthened while the major wall structure remains stable.
The supplied daily GEX History snapshot shows all tracked horizons aligned in positive gamma. This describes a more dampened-vol backdrop, not a directional signal. The higher-low structure and hold above 180 provide momentum confirmation for now.
🔶 Immediate Reaction Zone 🔶
👉 190 – C2 + Ab1
Confluence at 190 — October 16 cumulative profile, 31 DTE:
🔶 Primary Call Wall 🔶
👉 200 – C1
Confluence at 200:
🔶 Support and Downside Structure 🔶
👉 180 – cTrans + PV: call-cluster boundary, strongest cumulative put-volume strike and first breakout support.
Below 180, QCOM would return to the transition zone toward the 162.5 HVL.
👉 160 – P1 + POI: strongest put wall combined with the highest put open interest.
🔶 Key Structure to Watch 🔶
The key question is whether price can accept above 190 and continue toward 200—or whether the new Ab1 concentration produces rejection.
At 187.71, price remains above 180—the start of the call cluster—and above the 185 C3 wall. The immediate test is now the strengthened 190 reaction zone, only 2.29 points above spot.
The dominant 200 call wall remains the larger upside decision point. Until 200 is cleared and accepted, QCOM has not entered the positive extension zone.
🔶 Regime Context 🔶
Price remains well above the 162.5 HVL, maintaining a positive GEX regime. The positive net gamma concentration has strengthened while the major wall structure remains stable.
The supplied daily GEX History snapshot shows all tracked horizons aligned in positive gamma. This describes a more dampened-vol backdrop, not a directional signal. The higher-low structure and hold above 180 provide momentum confirmation for now.
🔶 Immediate Reaction Zone 🔶
👉 190 – C2 + Ab1
Confluence at 190 — October 16 cumulative profile, 31 DTE:
- C2 — second-largest call wall
- Ab1 — largest absolute-gamma concentration
🔶 Primary Call Wall 🔶
👉 200 – C1
Confluence at 200:
- C1 — highest call NETGEX
- COI / nCOI — strongest call open-interest concentration
- AbOI — highest absolute open interest
- CV / nCV — strongest cumulative call-volume concentration
🔶 Support and Downside Structure 🔶
👉 180 – cTrans + PV: call-cluster boundary, strongest cumulative put-volume strike and first breakout support.
Below 180, QCOM would return to the transition zone toward the 162.5 HVL.
👉 160 – P1 + POI: strongest put wall combined with the highest put open interest.
🔶 Key Structure to Watch 🔶
- 190 — C2 + Ab1 immediate reaction zone
- 200 — C1 and multi-metric confluence
- 180 — cTrans + PV breakout support
The key question is whether price can accept above 190 and continue toward 200—or whether the new Ab1 concentration produces rejection.

Boost up your charts with Options PRO!
REAL Options metrics for over 250+ liquid US symbols:
✔ 𝗔𝘂𝘁𝗼-𝗨𝗽𝗱𝗮𝘁𝗶𝗻𝗴 𝗚𝗘𝗫 𝗹𝗲𝘃𝗲𝗹𝘀
✔ GEX ✔ IVRank ✔ CALL/PUT skew ✔ Volatility✔ Delta curves
👉 7-day FREE TRIAL 🌐 TanukiTrade.com
REAL Options metrics for over 250+ liquid US symbols:
✔ 𝗔𝘂𝘁𝗼-𝗨𝗽𝗱𝗮𝘁𝗶𝗻𝗴 𝗚𝗘𝗫 𝗹𝗲𝘃𝗲𝗹𝘀
✔ GEX ✔ IVRank ✔ CALL/PUT skew ✔ Volatility✔ Delta curves
👉 7-day FREE TRIAL 🌐 TanukiTrade.com
Powiązane publikacje
Wyłączenie odpowiedzialności
Informacje i publikacje nie stanowią i nie powinny być traktowane jako porady finansowe, inwestycyjne, tradingowe ani jakiekolwiek inne rekomendacje dostarczane lub zatwierdzone przez TradingView. Więcej informacji znajduje się w Warunkach użytkowania.
Boost up your charts with Options PRO!
REAL Options metrics for over 250+ liquid US symbols:
✔ 𝗔𝘂𝘁𝗼-𝗨𝗽𝗱𝗮𝘁𝗶𝗻𝗴 𝗚𝗘𝗫 𝗹𝗲𝘃𝗲𝗹𝘀
✔ GEX ✔ IVRank ✔ CALL/PUT skew ✔ Volatility✔ Delta curves
👉 7-day FREE TRIAL 🌐 TanukiTrade.com
REAL Options metrics for over 250+ liquid US symbols:
✔ 𝗔𝘂𝘁𝗼-𝗨𝗽𝗱𝗮𝘁𝗶𝗻𝗴 𝗚𝗘𝗫 𝗹𝗲𝘃𝗲𝗹𝘀
✔ GEX ✔ IVRank ✔ CALL/PUT skew ✔ Volatility✔ Delta curves
👉 7-day FREE TRIAL 🌐 TanukiTrade.com
Powiązane publikacje
Wyłączenie odpowiedzialności
Informacje i publikacje nie stanowią i nie powinny być traktowane jako porady finansowe, inwestycyjne, tradingowe ani jakiekolwiek inne rekomendacje dostarczane lub zatwierdzone przez TradingView. Więcej informacji znajduje się w Warunkach użytkowania.