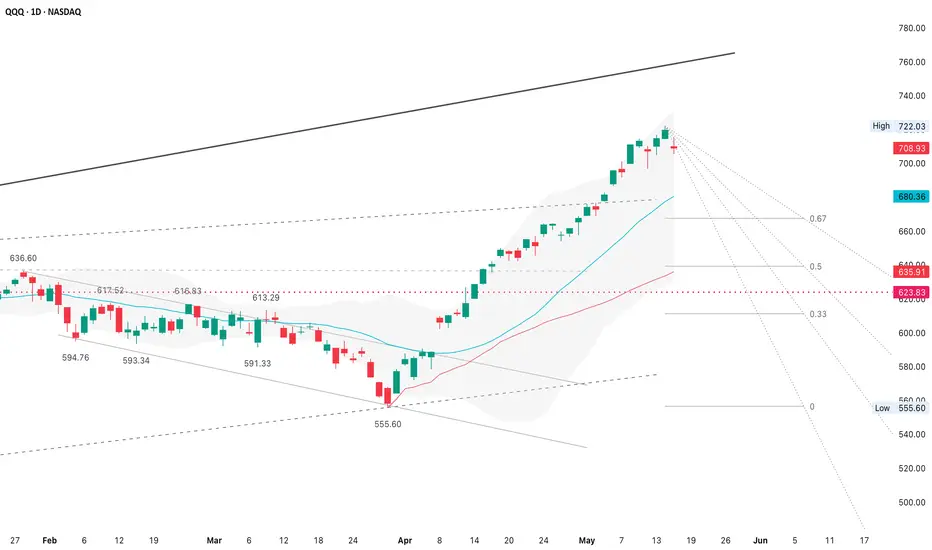
All 3 indices are still in higher-timeframe uptrends after the April V-reversal, but the structure is beginning to look late-stage impulsive rather than early accumulation
 QQQ remains in a strong bullish market structure
The push through $700–$705 likely acted as a buy-side liquidity sweep
This is hidden bearish divergence
The rally from the April lows was validated by strong participation initially, but the last leg from ~$680 → ~$720 occurred on declining relative volume, while RSI remained pinned >70 & MACD expansion slowed

Usually precedes either consolidation, volatility compression, or sharp mean-reversion
 SPY looks structurally healthier than QQQ because breadth is somewhat better, fewer parabolic candles

Cleaner stair-step advance, but the same warning signs exist — RSI > 70 rolling lower,
MACD histogram decelerating & rejection directly beneath R2/extension levels
 IWM is the most important tell here

Unlike QQQ/SPY, it failed to sustain above R2, already lost near-term momentum & closed back toward R1 support
From the option chain data
1.QQQ
2.SPY
3.IWM
The market isn't chasing upside convexity aggressively, but is paying materially for downside protection
Likely dealer gamma areas
1.QQQ
2.SPY
3.IWM
QQQ
SPY
IWM
Best risk/reward remains a short-term downside mean-reversion → not outright trend reversal, but a tactical pullback setup
1.QQQ
2.SPY
3.IWM
1σ expected move approximate near-term 1σ move
Current price is already pressing the upper side of those expected distributions, which increases mean-reversion probability unless a fresh catalyst appears
The key tell this week is whether QQQ/SPY can reclaim & hold above extension highs,
or whether this week becomes a failed breakout & liquidity sweep above prior highs
- The key divergence is IWM underperformance
- Relative weakness in small caps is typically consistent with rising real yields/tighter financial conditions, growth leadership narrowing & institutional rotation into mega-cap quality rather than broad risk-on participation
- This matters because durable bull continuation usually wants breadth expansion, cyclicals confirming & small caps leading
- Right now, breadth is fading while QQQ remains extended above its intermediate trend averages
QQQ remains in a strong bullish market structure- Trend still above 20d & 50d MAs
- Anchored trend support
- However, price is now trading deep into the 100% measured extension (~$722), upper volatility envelope & overbought momentum conditions
- The last several candles show shorter real bodies, increased upper wicks & slowing momentum despite price making higher highs
- That is classic distributional behavior after an impulse leg
The push through $700–$705 likely acted as a buy-side liquidity sweep
- Price expanded aggressively into psychological resistance, extension resistance & crowded call positioning, but RSI failed to accelerate materially with price, MACD histogram is flattening & volume is declining versus the April rally phase
This is hidden bearish divergence
- Price higher highs
- Momentum plateauing
- The market is signaling continuation is getting increasingly expensive
The rally from the April lows was validated by strong participation initially, but the last leg from ~$680 → ~$720 occurred on declining relative volume, while RSI remained pinned >70 & MACD expansion slowed
Usually precedes either consolidation, volatility compression, or sharp mean-reversion
- A daily close back below R2 after tagging highs looks like a failed breakout acceptance, probable reversion toward the 20d mean
SPY looks structurally healthier than QQQ because breadth is somewhat better, fewer parabolic candlesCleaner stair-step advance, but the same warning signs exist — RSI > 70 rolling lower,
MACD histogram decelerating & rejection directly beneath R2/extension levels
- Resistance $740–$750
- Major breakout trigger >$750
- Fair value/equilibrium $723–$728
- First downside magnet $710
- Major support $695 pivot
- Breakdown acceleration <$690
IWM is the most important tell hereUnlike QQQ/SPY, it failed to sustain above R2, already lost near-term momentum & closed back toward R1 support
- This is a potential failed breakout, bearish MSS (market structure shift) & relative risk-off signal
- If yields continue higher, IWM likely underperforms further
From the option chain data
1.
QQQ - 25Δ call IV ~19.9%
- 25Δ put IV ~25.5%
- Strong downside skew
2.
SPY- 25Δ call IV ~11.0%
- 25Δ put IV~16.7%
- Defensive hedging bid
3.
IWM - 25Δ call IV ~19.6%
- 25Δ put IV ~28.2%
- Heavy downside demand
The market isn't chasing upside convexity aggressively, but is paying materially for downside protection
- Consistent with institutions hedging into strength, not panic, but cautious positioning near extension highs
- IWM put skew especially stands out
- Current environment appears to be realized trend slowing, implied volatility stabilizing rather than collapsing
- Suggests market expects larger directional movement soon, likely transition from grind-up to expansion regime
- This doesn't look like a pure volatility crush environment anymore
Likely dealer gamma areas
1.
QQQ- Major positive gamma support $680–$685
- Resistance/call wall $720–$725
- Trigger level above $725 could squeeze toward $740 rapidly
2.
SPY- Gamma support $723
- Resistance $740–$750
- Volatility trigger below $720
3.
IWM- Key support $277–$280
- Air pocket below $270
- Resistance $287–$290
- IWM losing $277 likely accelerates dealer short gamma behavior faster than QQQ/SPY
- Fair value/equilibrium
QQQ- Fair value $680–$690
- Current price stretched above equilibrium
SPY- Fair value $720–$728
IWM- Fair value $268–$272
Best risk/reward remains a short-term downside mean-reversion → not outright trend reversal, but a tactical pullback setup
1.
QQQ - $700–$705 rejection continuation
- Target $690 first, $680 main magnet
- Invalidation on daily acceptance above $722–$725
2.
SPY- Bearish below $740
- Target $723, then $710
- Invalidation on sustained breakout above $750
3.
IWM- Bearish below $280
- Target $270, then $267 pivot
- Invalidation on reclaim above $288
1σ expected move approximate near-term 1σ move
- QQQ ±16–18 → expected range roughly $690–$725
- SPY ±14–16 → roughly $724–$755
- IWM ±7–8 → roughly $270–$286
Current price is already pressing the upper side of those expected distributions, which increases mean-reversion probability unless a fresh catalyst appears
- This is still technically a bullish higher-timeframe market, but momentum is decelerating, breadth is narrowing, small caps are failing, downside skew is elevated & rallies are occurring on thinner participation
- Combination usually precedes consolidation, pullback into moving averages, or a volatility expansion lower before the next sustainable advance
The key tell this week is whether QQQ/SPY can reclaim & hold above extension highs,
or whether this week becomes a failed breakout & liquidity sweep above prior highs

Market structure, daily & intraday levels, pakoumal.substack.com — all signal, no noise or hype.
Wyłączenie odpowiedzialności
Informacje i publikacje nie stanowią i nie powinny być traktowane jako porady finansowe, inwestycyjne, tradingowe ani jakiekolwiek inne rekomendacje dostarczane lub zatwierdzone przez TradingView. Więcej informacji znajduje się w Warunkach użytkowania.
Market structure, daily & intraday levels, pakoumal.substack.com — all signal, no noise or hype.
Wyłączenie odpowiedzialności
Informacje i publikacje nie stanowią i nie powinny być traktowane jako porady finansowe, inwestycyjne, tradingowe ani jakiekolwiek inne rekomendacje dostarczane lub zatwierdzone przez TradingView. Więcej informacji znajduje się w Warunkach użytkowania.