
1. The Macro Perspective: The Massive Accumulation Cup
I am taking a LONG bias on Radico Khaitan Limited (RADICO) on the daily (1D) timeframe.
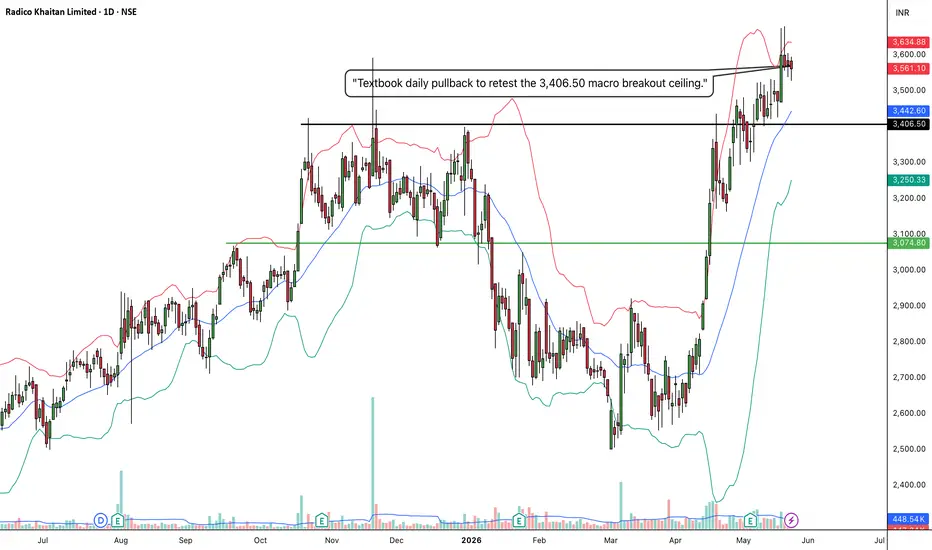
When analyzing pure market structure, sustainable long-term trends do not move in a straight line; they breathe through cycles of expansion and compression. Look at the extensive structural development displayed across Screenshot 2026-05-23 at 17.07.29.jpg. After a major markup phase that topped out in late 2025, the stock underwent an extensive corrective digestion phase, dropping down toward the 2,500–2,600 area. This deep correction washed out weak retail hands and allowed institutional buyers to absorb liquidity at a steep discount. Over the last few months, the stock has systematically carved out a massive rounding recovery, marching back up the right side of the base to challenge key historical supply.
2. The Educational Setup: Neckline Clearance and Volatility Squeeze
To understand the technical validity behind this massive breakout structure, we examine the clear horizontal parameters and dynamic indicators acting across the chart:
The Major Resistance Ceiling: The absolute horizontal line to watch is the solid black line drawn at 3,406.50. This level has historically acted as a major roadblock where sellers aggressively blocked further upward expansion, establishing a key macro neckline.
The Bollinger Band Springboard: Notice how the price action behaved leading up to the breakout. As the price climbed back to the 3,406.50 ceiling, the Bollinger Bands expanded and the price began riding the upper band. Following that initial vertical surge, the stock has entered a tight consolidation phase, allowing the rising daily 20 SMA (the middle blue line of your Bollinger Bands, currently near 3,442.60) to catch up and act as a dynamic cushion.
3. Current Price Action: The Ultimate Retest Confirmation
Look closely at the most recent daily candles on the far right of the chart. After an explosive momentum thrust that launched the price to local highs near 3,634.88, the stock is executing a highly controlled, shallow pullback. To amateur retail traders, these minor red candles look like a failed rally. To structural price action traders, this is a textbook "Break and Retest" pattern. The stock is pulling back to perfectly test the 3,406.50 breakout line and the daily 20 SMA from above. By holding its ground here, that old, heavy historical resistance is officially being flipped into a brand-new, indestructible structural launchpad.
4. The Trade Plan: Entries, Targets, and Risk Management
Entry Strategy: We are currently sitting directly inside the highest-probability "golden entry" zone. Chasing the initial vertical breakout candle is always dangerous due to mean-reversion risks, which is exactly why we wait for pullbacks like this. The lowest-risk entry involves scaling into long positions within the current 3,400.00 to 3,460.00 digestion range, looking for a strong daily reversal candle to confirm that buyers are aggressively defending this newly claimed support floor.
Take Profit (Targets): Because the stock is clearing a major macro base to target fresh multi-year highs, we use a measured move strategy. By taking the depth of the rounding base (roughly 850 points from the ~2,550 floor up to the 3,406 breakout neckline) and projecting it upward, our primary structural macro target sits comfortably in the 4,200.00 to 4,250.00 zone over the coming weeks. Near-term psychological targets rest at 3,800.00 and 4,000.00.
Invalidation (Stop Loss): A break-and-retest thesis is completely invalidated if the price fails to defend its new floor and slips back into the core of its older base. A hard stop loss should be placed safely below the recent swing low and the green structural line, specifically around the 3,040.00 to 3,080.00 zone. A definitive daily close completely back below 3,050 would act as a major warning sign of a failed macro breakout and a severe bull trap.
5. Time Horizon:
Because this technical setup is engineered on a 1-Day chart capturing a clean range breakout and an immediate structural retest, this is a high-alpha swing trade designed to capture a rapid momentum continuation over the coming days and weeks. Let the markup phase run!
I am taking a LONG bias on Radico Khaitan Limited (RADICO) on the daily (1D) timeframe.
When analyzing pure market structure, sustainable long-term trends do not move in a straight line; they breathe through cycles of expansion and compression. Look at the extensive structural development displayed across Screenshot 2026-05-23 at 17.07.29.jpg. After a major markup phase that topped out in late 2025, the stock underwent an extensive corrective digestion phase, dropping down toward the 2,500–2,600 area. This deep correction washed out weak retail hands and allowed institutional buyers to absorb liquidity at a steep discount. Over the last few months, the stock has systematically carved out a massive rounding recovery, marching back up the right side of the base to challenge key historical supply.
2. The Educational Setup: Neckline Clearance and Volatility Squeeze
To understand the technical validity behind this massive breakout structure, we examine the clear horizontal parameters and dynamic indicators acting across the chart:
The Major Resistance Ceiling: The absolute horizontal line to watch is the solid black line drawn at 3,406.50. This level has historically acted as a major roadblock where sellers aggressively blocked further upward expansion, establishing a key macro neckline.
The Bollinger Band Springboard: Notice how the price action behaved leading up to the breakout. As the price climbed back to the 3,406.50 ceiling, the Bollinger Bands expanded and the price began riding the upper band. Following that initial vertical surge, the stock has entered a tight consolidation phase, allowing the rising daily 20 SMA (the middle blue line of your Bollinger Bands, currently near 3,442.60) to catch up and act as a dynamic cushion.
3. Current Price Action: The Ultimate Retest Confirmation
Look closely at the most recent daily candles on the far right of the chart. After an explosive momentum thrust that launched the price to local highs near 3,634.88, the stock is executing a highly controlled, shallow pullback. To amateur retail traders, these minor red candles look like a failed rally. To structural price action traders, this is a textbook "Break and Retest" pattern. The stock is pulling back to perfectly test the 3,406.50 breakout line and the daily 20 SMA from above. By holding its ground here, that old, heavy historical resistance is officially being flipped into a brand-new, indestructible structural launchpad.
4. The Trade Plan: Entries, Targets, and Risk Management
Entry Strategy: We are currently sitting directly inside the highest-probability "golden entry" zone. Chasing the initial vertical breakout candle is always dangerous due to mean-reversion risks, which is exactly why we wait for pullbacks like this. The lowest-risk entry involves scaling into long positions within the current 3,400.00 to 3,460.00 digestion range, looking for a strong daily reversal candle to confirm that buyers are aggressively defending this newly claimed support floor.
Take Profit (Targets): Because the stock is clearing a major macro base to target fresh multi-year highs, we use a measured move strategy. By taking the depth of the rounding base (roughly 850 points from the ~2,550 floor up to the 3,406 breakout neckline) and projecting it upward, our primary structural macro target sits comfortably in the 4,200.00 to 4,250.00 zone over the coming weeks. Near-term psychological targets rest at 3,800.00 and 4,000.00.
Invalidation (Stop Loss): A break-and-retest thesis is completely invalidated if the price fails to defend its new floor and slips back into the core of its older base. A hard stop loss should be placed safely below the recent swing low and the green structural line, specifically around the 3,040.00 to 3,080.00 zone. A definitive daily close completely back below 3,050 would act as a major warning sign of a failed macro breakout and a severe bull trap.
5. Time Horizon:
Because this technical setup is engineered on a 1-Day chart capturing a clean range breakout and an immediate structural retest, this is a high-alpha swing trade designed to capture a rapid momentum continuation over the coming days and weeks. Let the markup phase run!
Transakcja zamknięta: osiągnięto wyznaczony cel
Target already achieved.
Wyłączenie odpowiedzialności
Informacje i publikacje nie stanowią i nie powinny być traktowane jako porady finansowe, inwestycyjne, tradingowe ani jakiekolwiek inne rekomendacje dostarczane lub zatwierdzone przez TradingView. Więcej informacji znajduje się w Warunkach użytkowania.
Wyłączenie odpowiedzialności
Informacje i publikacje nie stanowią i nie powinny być traktowane jako porady finansowe, inwestycyjne, tradingowe ani jakiekolwiek inne rekomendacje dostarczane lub zatwierdzone przez TradingView. Więcej informacji znajduje się w Warunkach użytkowania.