
RAVEUSDT | Post-Crash Accumulation → Base Formation → Parabolic
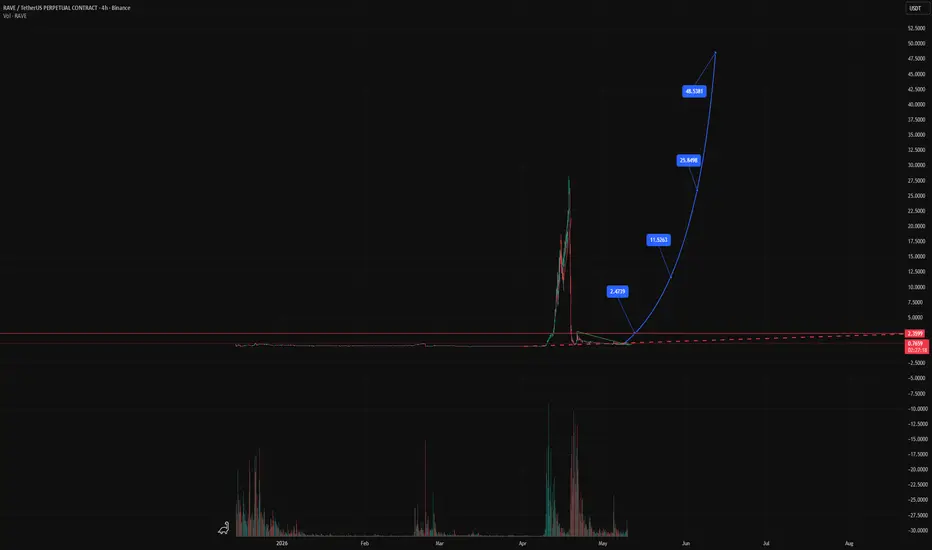
RAVEUSDT | Post-Crash Accumulation → Base Formation → Parabolic Expansion Setup 🚀
RAVEUSDT has undergone a classic blow-off top followed by a full market reset, with price collapsing sharply after an aggressive rally. Since then, price has entered a prolonged low-volatility accumulation phase near the base.
━━━━━━━━━━━━━━━
📊 Market Structure Breakdown
• Initial phase: Parabolic expansion → distribution → sharp liquidation
• Current phase: Compression at lows with reduced volatility
• Price action now shows signs of base stabilization
The long sideways structure suggests:
→ Weak hands fully shaken out
→ Supply absorbed over time
→ Potential accumulation by stronger participants
━━━━━━━━━━━━━━━
💡 Key Structural Insight
After extreme moves, markets typically cycle through:
Expansion → Distribution → Collapse → Accumulation → Re-Expansion
RAVE appears to be transitioning from:
Accumulation → Early Expansion Phase
━━━━━━━━━━━━━━━
🚀 Projected Expansion Path
The marked projection outlines a high-volatility expansion scenario:
🔹 Phase 1: Breakout from base (~2.4 region)
🔹 Phase 2: Acceleration toward mid-range (~11.5)
🔹 Phase 3: Momentum continuation (~25.8)
🔹 Phase 4: Potential parabolic move (~48+)
These levels represent liquidity magnets where price may react during expansion.
━━━━━━━━━━━━━━━
⚠️ Risk & Invalidation
• Failure to hold above base support
• Continued low-volume chop without breakout
• Rejection from initial breakout level
This would indicate prolonged accumulation or further downside.
━━━━━━━━━━━━━━━
🧠 Key Insight
Low-volatility bases after extreme crashes often precede high-impact expansion moves.
The longer the compression, the stronger the potential breakout.
━━━━━━━━━━━━━━━
📌 Conclusion
RAVEUSDT is currently positioned at a critical inflection point.
A confirmed breakout from this base could trigger a [b>multi-stage expansion toward higher liquidity zones.
Patience is key — the move, if triggered, can be explosive.
RAVEUSDT has undergone a classic blow-off top followed by a full market reset, with price collapsing sharply after an aggressive rally. Since then, price has entered a prolonged low-volatility accumulation phase near the base.
━━━━━━━━━━━━━━━
📊 Market Structure Breakdown
• Initial phase: Parabolic expansion → distribution → sharp liquidation
• Current phase: Compression at lows with reduced volatility
• Price action now shows signs of base stabilization
The long sideways structure suggests:
→ Weak hands fully shaken out
→ Supply absorbed over time
→ Potential accumulation by stronger participants
━━━━━━━━━━━━━━━
💡 Key Structural Insight
After extreme moves, markets typically cycle through:
Expansion → Distribution → Collapse → Accumulation → Re-Expansion
RAVE appears to be transitioning from:
Accumulation → Early Expansion Phase
━━━━━━━━━━━━━━━
🚀 Projected Expansion Path
The marked projection outlines a high-volatility expansion scenario:
🔹 Phase 1: Breakout from base (~2.4 region)
🔹 Phase 2: Acceleration toward mid-range (~11.5)
🔹 Phase 3: Momentum continuation (~25.8)
🔹 Phase 4: Potential parabolic move (~48+)
These levels represent liquidity magnets where price may react during expansion.
━━━━━━━━━━━━━━━
⚠️ Risk & Invalidation
• Failure to hold above base support
• Continued low-volume chop without breakout
• Rejection from initial breakout level
This would indicate prolonged accumulation or further downside.
━━━━━━━━━━━━━━━
🧠 Key Insight
Low-volatility bases after extreme crashes often precede high-impact expansion moves.
The longer the compression, the stronger the potential breakout.
━━━━━━━━━━━━━━━
📌 Conclusion
RAVEUSDT is currently positioned at a critical inflection point.
A confirmed breakout from this base could trigger a [b>multi-stage expansion toward higher liquidity zones.
Patience is key — the move, if triggered, can be explosive.

Wyłączenie odpowiedzialności
Informacje i publikacje nie stanowią i nie powinny być traktowane jako porady finansowe, inwestycyjne, tradingowe ani jakiekolwiek inne rekomendacje dostarczane lub zatwierdzone przez TradingView. Więcej informacji znajduje się w Warunkach użytkowania.
Wyłączenie odpowiedzialności
Informacje i publikacje nie stanowią i nie powinny być traktowane jako porady finansowe, inwestycyjne, tradingowe ani jakiekolwiek inne rekomendacje dostarczane lub zatwierdzone przez TradingView. Więcej informacji znajduje się w Warunkach użytkowania.