
⚠️ TECHNICAL NOTE & DISCLAIMER:
Due to TradingView's restrictions on private proprietary source codes, the live chart lines have been manually replicated on top of our script's exact coordinates so you can track the live interactive development. Please refer to the high-resolution screenshot attached in the body below to see the raw, unedited algorithmic engine interface. This post is shared purely for educational and statistical reflection; I am not selling anything, nor is this financial advice. 👇

🔮 The Power of Pure Macro-Geometry
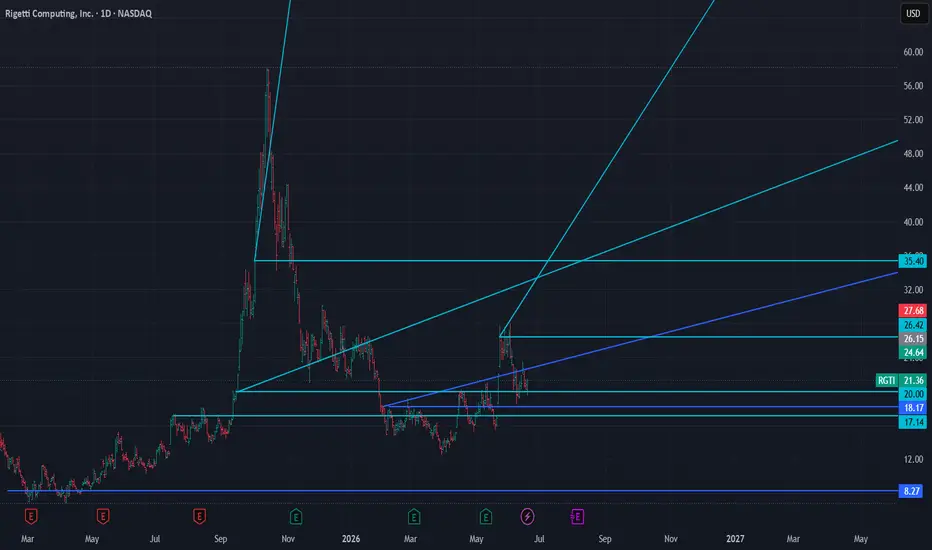
By projecting price action through a proprietary mathematical model designed to filter market noise and isolate institutional order flow, a high-definition Dynamic Symmetrical Expansion Channel has crystallized on the Daily chart of Rigetti Computing (RGTI).
This structure tracks systemic momentum distribution. As observed, the upper dynamic vectors mathematically capped the absolute macro-distribution tops, while the lower boundary vectors are tracking the cyclical accumulation bottoms with surgical precision. 🎯
⚡ The Setup: Multilayered Structural Confluence
We are currently witnessing a textbook, high-probability swing trading node, defined by an exceptional confluence of independent statistical and geometric variables:
📊 Statistical Demand Grid: Price has retraced directly into our primary horizontal support cluster spanning between $18.17 and $20.00. This area represents a non-discretionary zone of historical sell-side order absorption and passive liquidity building.
📐 Dynamic Vector Intersection: This static demand block mathematically converges with the exact trajectory of the lower ascending dynamic boundary (the solid blue oblique vector).
When historical statistical baselines and dynamic mathematical vectors intersect on the exact same price-time coordinate, the market creates a massive institutional liquidity pocket. We are observing the initial long-tail demand reaction right now. 🔥
🛡️ Risk & Target Parameters (Pure Framework Mapping)
🎯 Tactical Entry Zone: Current market range ($20.00 - $21.50) offers a highly asymmetric entry point with maximized risk-to-reward ratios.
🛑 Invalidation Architecture: Instead of looking at a single price point, invalidation is defined by a systemic macro breakdown. The $17.14 - $18.17 corridor acts as our structural invalidation floor. A sustained daily close below this entire multi-layered horizontal cluster definition forces a thesis invalidation.
🚀 Target Architecture
Within this verified algorithmic framework, the upside targets are clearly defined by our horizontal and dynamic resistance layers:
🏁 Primary Target: The immediate horizontal resistance level sitting at $26.42. This is our first static validation point.
🌌 Macro Target (Channel Expansion): Above that, the price has open space to rotate upward through the channel structure, targeting the major horizontal cluster and dynamic overhead resistance up to the $35.40 region.
Pure geometry. Zero human bias. Let's see how the market respects this algorithmic grid over the coming sessions. 💎
Due to TradingView's restrictions on private proprietary source codes, the live chart lines have been manually replicated on top of our script's exact coordinates so you can track the live interactive development. Please refer to the high-resolution screenshot attached in the body below to see the raw, unedited algorithmic engine interface. This post is shared purely for educational and statistical reflection; I am not selling anything, nor is this financial advice. 👇
🔮 The Power of Pure Macro-Geometry
By projecting price action through a proprietary mathematical model designed to filter market noise and isolate institutional order flow, a high-definition Dynamic Symmetrical Expansion Channel has crystallized on the Daily chart of Rigetti Computing (RGTI).
This structure tracks systemic momentum distribution. As observed, the upper dynamic vectors mathematically capped the absolute macro-distribution tops, while the lower boundary vectors are tracking the cyclical accumulation bottoms with surgical precision. 🎯
⚡ The Setup: Multilayered Structural Confluence
We are currently witnessing a textbook, high-probability swing trading node, defined by an exceptional confluence of independent statistical and geometric variables:
📊 Statistical Demand Grid: Price has retraced directly into our primary horizontal support cluster spanning between $18.17 and $20.00. This area represents a non-discretionary zone of historical sell-side order absorption and passive liquidity building.
📐 Dynamic Vector Intersection: This static demand block mathematically converges with the exact trajectory of the lower ascending dynamic boundary (the solid blue oblique vector).
When historical statistical baselines and dynamic mathematical vectors intersect on the exact same price-time coordinate, the market creates a massive institutional liquidity pocket. We are observing the initial long-tail demand reaction right now. 🔥
🛡️ Risk & Target Parameters (Pure Framework Mapping)
🎯 Tactical Entry Zone: Current market range ($20.00 - $21.50) offers a highly asymmetric entry point with maximized risk-to-reward ratios.
🛑 Invalidation Architecture: Instead of looking at a single price point, invalidation is defined by a systemic macro breakdown. The $17.14 - $18.17 corridor acts as our structural invalidation floor. A sustained daily close below this entire multi-layered horizontal cluster definition forces a thesis invalidation.
🚀 Target Architecture
Within this verified algorithmic framework, the upside targets are clearly defined by our horizontal and dynamic resistance layers:
🏁 Primary Target: The immediate horizontal resistance level sitting at $26.42. This is our first static validation point.
🌌 Macro Target (Channel Expansion): Above that, the price has open space to rotate upward through the channel structure, targeting the major horizontal cluster and dynamic overhead resistance up to the $35.40 region.
Pure geometry. Zero human bias. Let's see how the market respects this algorithmic grid over the coming sessions. 💎

Wyłączenie odpowiedzialności
Informacje i publikacje nie stanowią i nie powinny być traktowane jako porady finansowe, inwestycyjne, tradingowe ani jakiekolwiek inne rekomendacje dostarczane lub zatwierdzone przez TradingView. Więcej informacji znajduje się w Warunkach użytkowania.
Wyłączenie odpowiedzialności
Informacje i publikacje nie stanowią i nie powinny być traktowane jako porady finansowe, inwestycyjne, tradingowe ani jakiekolwiek inne rekomendacje dostarczane lub zatwierdzone przez TradingView. Więcej informacji znajduje się w Warunkach użytkowania.