
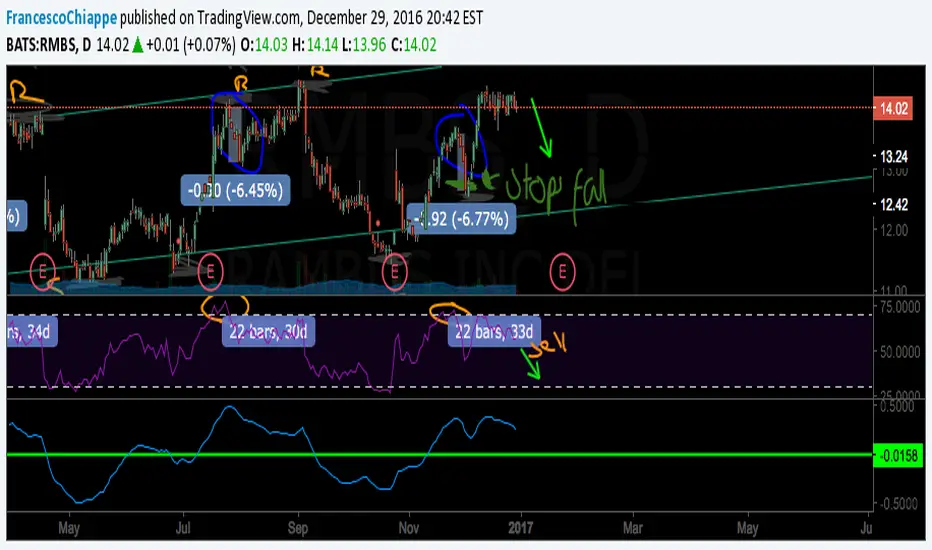
I have been following this stock for a long time and have made great returns with it. The pattern scheme between the chart and the RSI can be used to predict an upcoming downtrend in the price of RMBS. Once the RSI exceeds 75 the chart bounces as the RSI levels out. This leveling out process takes about 20 bars (1 D) and then drops again. The MACD is also showing bearish signs. Any feedback or suggestions would be greatly appreciated!
Also:
Many of the drawings were done prior to movement in the chart. For example, my prediction of the "Stop Fall" in green was done prior to the chart actually stopping at the line.
Also:
Many of the drawings were done prior to movement in the chart. For example, my prediction of the "Stop Fall" in green was done prior to the chart actually stopping at the line.

Wyłączenie odpowiedzialności
Informacje i publikacje nie stanowią i nie powinny być traktowane jako porady finansowe, inwestycyjne, tradingowe ani jakiekolwiek inne rekomendacje dostarczane lub zatwierdzone przez TradingView. Więcej informacji znajduje się w Warunkach użytkowania.
Wyłączenie odpowiedzialności
Informacje i publikacje nie stanowią i nie powinny być traktowane jako porady finansowe, inwestycyjne, tradingowe ani jakiekolwiek inne rekomendacje dostarczane lub zatwierdzone przez TradingView. Więcej informacji znajduje się w Warunkach użytkowania.