
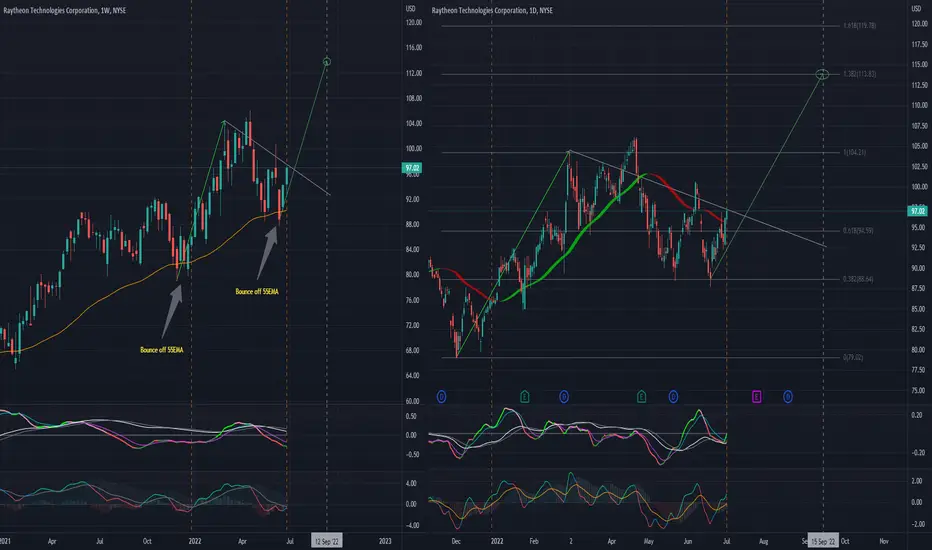
A repeated patter on the weekly RTX chart appears to be forming, and technical indicators are set up similarly.
The daily chart is also in alignment as previously. Technical Indicators have just crossed over and suggest a breakout is in order.
About 15% upside potential with upside target at 113.80, about mid-September 2022.
Fundamental and geopolitical alignment should start appearing soon...
Watch this one!
The daily chart is also in alignment as previously. Technical Indicators have just crossed over and suggest a breakout is in order.
About 15% upside potential with upside target at 113.80, about mid-September 2022.
Fundamental and geopolitical alignment should start appearing soon...
Watch this one!

Wyłączenie odpowiedzialności
Informacje i publikacje nie stanowią i nie powinny być traktowane jako porady finansowe, inwestycyjne, tradingowe ani jakiekolwiek inne rekomendacje dostarczane lub zatwierdzone przez TradingView. Więcej informacji znajduje się w Warunkach użytkowania.
Wyłączenie odpowiedzialności
Informacje i publikacje nie stanowią i nie powinny być traktowane jako porady finansowe, inwestycyjne, tradingowe ani jakiekolwiek inne rekomendacje dostarczane lub zatwierdzone przez TradingView. Więcej informacji znajduje się w Warunkach użytkowania.