
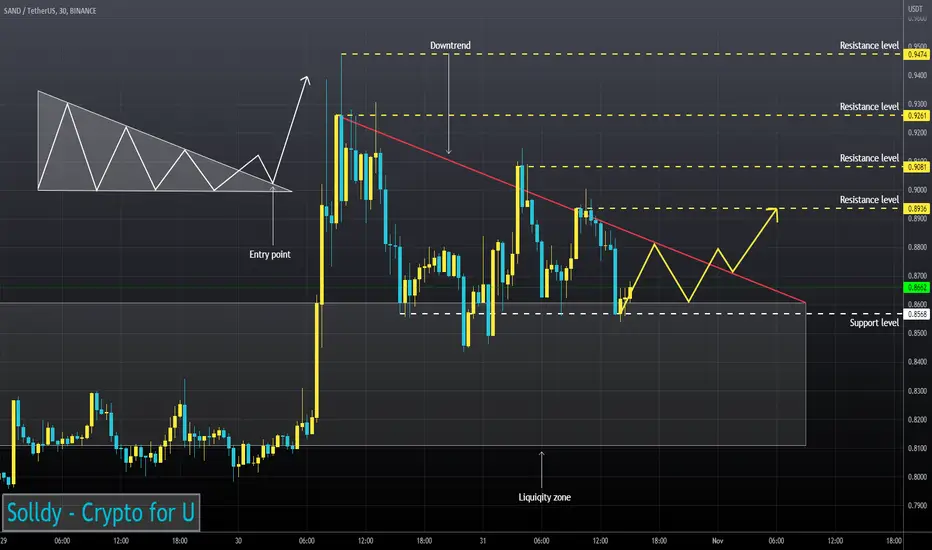
Trading volumes don't show sellers' interest in further price decrease.
SAND continues to move above the liquidity zone.
RSI continues to move in the Buy zone (4H TF) and at 30m Timeframe the RSI chart is testing the support level.
Price is testing 50EMA as support (1H TF)
I think the asset may bounce after it fixes above the downtrend line.
SAND continues to move above the liquidity zone.
RSI continues to move in the Buy zone (4H TF) and at 30m Timeframe the RSI chart is testing the support level.
Price is testing 50EMA as support (1H TF)
I think the asset may bounce after it fixes above the downtrend line.

Powiązane publikacje
Wyłączenie odpowiedzialności
Informacje i publikacje nie stanowią i nie powinny być traktowane jako porady finansowe, inwestycyjne, tradingowe ani jakiekolwiek inne rekomendacje dostarczane lub zatwierdzone przez TradingView. Więcej informacji znajduje się w Warunkach użytkowania.
Powiązane publikacje
Wyłączenie odpowiedzialności
Informacje i publikacje nie stanowią i nie powinny być traktowane jako porady finansowe, inwestycyjne, tradingowe ani jakiekolwiek inne rekomendacje dostarczane lub zatwierdzone przez TradingView. Więcej informacji znajduje się w Warunkach użytkowania.