
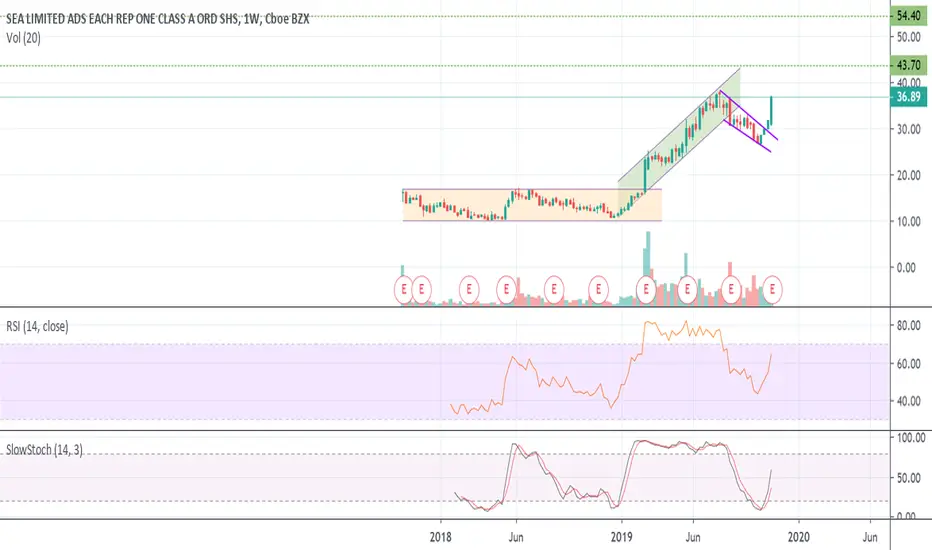
Looking at the weekly chart we can see the initial consolidation following their IPO. We finally saw a bullish breakout at the end of February which led to an ascending channel that held until August. The recent pullback could've been interpreted as a bull flag pattern that just had a bullish breakout last week as they were preparing for earnings. After releasing an amazing earnings announcement the stock has gapped up over 18% as I write this.
I have noted my price targets using the 61.8% & 100% Fibonacci Extension levels.
I have noted my price targets using the 61.8% & 100% Fibonacci Extension levels.

Wyłączenie odpowiedzialności
Informacje i publikacje nie stanowią i nie powinny być traktowane jako porady finansowe, inwestycyjne, tradingowe ani jakiekolwiek inne rekomendacje dostarczane lub zatwierdzone przez TradingView. Więcej informacji znajduje się w Warunkach użytkowania.
Wyłączenie odpowiedzialności
Informacje i publikacje nie stanowią i nie powinny być traktowane jako porady finansowe, inwestycyjne, tradingowe ani jakiekolwiek inne rekomendacje dostarczane lub zatwierdzone przez TradingView. Więcej informacji znajduje się w Warunkach użytkowania.