
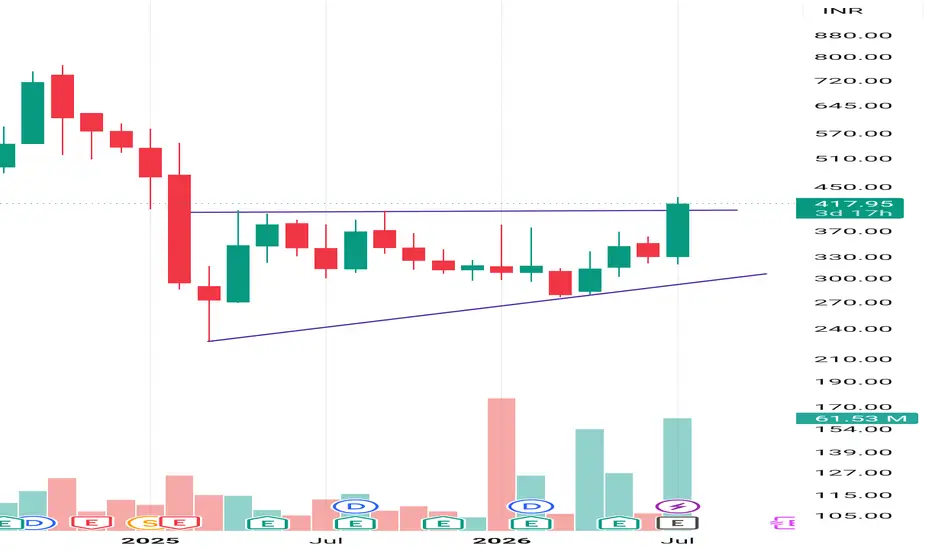
From the chart you've marked, this appears to be an Ascending Triangle Pattern.
Why?
Horizontal Resistance
Rising Trendline connecting higher lows (bottom purple line).
Price compressed inside the triangle for several candles.
Strong bullish breakout above the resistance with a large green candle.
Volume increased significantly on the breakout, which confirms buying interest.
This is a textbook Ascending Triangle Breakout.
What traders usually look for next
Ideal entry: After the breakout or on a retest of the breakout levell
Stop-loss: Below the last higher low or below the breakout level.
Target: Measure the height of the triangle and project it upward from the breakout point.
Is this a valid breakout?
Based on the monthly chart you've shared:
✔️ Breakout candle closed above resistance.
✔️ Volume is higher than previous months.
✔️ Bullish confirmation is present.
This pattern is not a Symmetrical Triangle or a Wedge. It is best classified as an Ascending Triangle Breakout.
Why?
Horizontal Resistance
Rising Trendline connecting higher lows (bottom purple line).
Price compressed inside the triangle for several candles.
Strong bullish breakout above the resistance with a large green candle.
Volume increased significantly on the breakout, which confirms buying interest.
This is a textbook Ascending Triangle Breakout.
What traders usually look for next
Ideal entry: After the breakout or on a retest of the breakout levell
Stop-loss: Below the last higher low or below the breakout level.
Target: Measure the height of the triangle and project it upward from the breakout point.
Is this a valid breakout?
Based on the monthly chart you've shared:
✔️ Breakout candle closed above resistance.
✔️ Volume is higher than previous months.
✔️ Bullish confirmation is present.
This pattern is not a Symmetrical Triangle or a Wedge. It is best classified as an Ascending Triangle Breakout.

Wyłączenie odpowiedzialności
Informacje i publikacje nie stanowią i nie powinny być traktowane jako porady finansowe, inwestycyjne, tradingowe ani jakiekolwiek inne rekomendacje dostarczane lub zatwierdzone przez TradingView. Więcej informacji znajduje się w Warunkach użytkowania.
Wyłączenie odpowiedzialności
Informacje i publikacje nie stanowią i nie powinny być traktowane jako porady finansowe, inwestycyjne, tradingowe ani jakiekolwiek inne rekomendacje dostarczane lub zatwierdzone przez TradingView. Więcej informacji znajduje się w Warunkach użytkowania.