
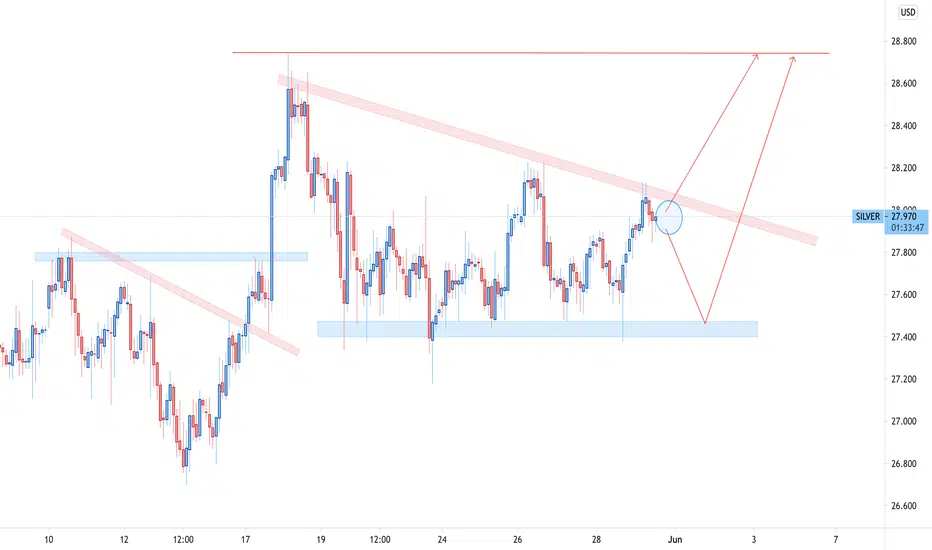
It can be seen from the chart that the price has formed a descending triangle pattern. The target is around 28.7 as illustrated on the chart. If the price breaks the descending trendline and closes above it, we will be opening LONG positions and aiming for our target. On the other hand, if the price manages to drop down till the are plotted on the graph, we will be looking for long positions from there. The risk-to-reward will be better in this case.

Wyłączenie odpowiedzialności
Informacje i publikacje nie stanowią i nie powinny być traktowane jako porady finansowe, inwestycyjne, tradingowe ani jakiekolwiek inne rekomendacje dostarczane lub zatwierdzone przez TradingView. Więcej informacji znajduje się w Warunkach użytkowania.
Wyłączenie odpowiedzialności
Informacje i publikacje nie stanowią i nie powinny być traktowane jako porady finansowe, inwestycyjne, tradingowe ani jakiekolwiek inne rekomendacje dostarczane lub zatwierdzone przez TradingView. Więcej informacji znajduje się w Warunkach użytkowania.