
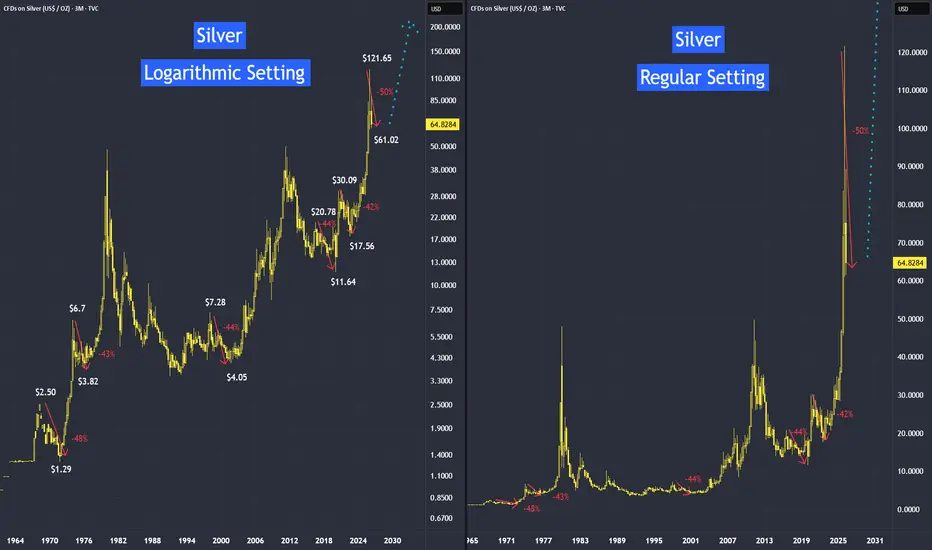
If we study the historical data using the regular setting, we may miss this phenomenon: a price collapse right before a major uptrend. However, if we switch to logarithmic mode, this price behavior becomes clear.
Why use logarithmic mode when studying the historical behaviour?
Answer: This scale makes historical peaks and troughs easier to see because it plots price movements based on percentage changes rather than absolute dollar amounts.
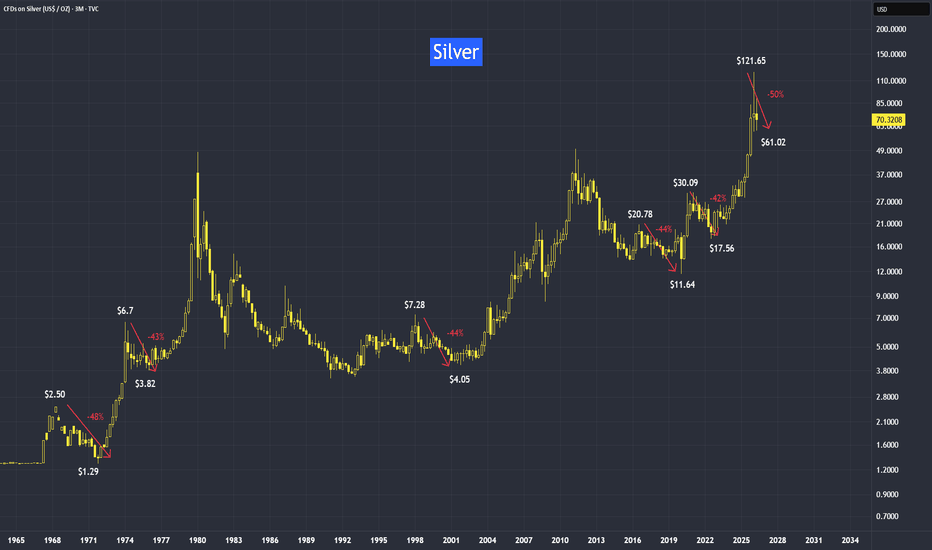
I came across several videos claiming that precious metals usually fall before surging to new highs. However, none of them provided actual statistics to back up this claim. Therefore, I decided to analyze the historical data for gold and silver to see if this assertion is accurate.
See the video version:
100-Ounce Silver Futures
Code: SIC
Minimum fluctuation
0.01 index points = $1.00
Disclaimer:
• What presented here is not a recommendation, please consult your licensed broker.
• Our mission is to create lateral thinking skills for every investor and trader, knowing when to take a calculated risk with market uncertainty and a bolder risk when opportunity arises.
CME Real-time Market Data help identify trading set-ups in real-time and express my market views. If you have futures in your trading portfolio, you can check out on CME Group data plans available that suit your trading needs tradingview.com/cme/
Why use logarithmic mode when studying the historical behaviour?
Answer: This scale makes historical peaks and troughs easier to see because it plots price movements based on percentage changes rather than absolute dollar amounts.
I came across several videos claiming that precious metals usually fall before surging to new highs. However, none of them provided actual statistics to back up this claim. Therefore, I decided to analyze the historical data for gold and silver to see if this assertion is accurate.
See the video version:
100-Ounce Silver Futures
Code: SIC
Minimum fluctuation
0.01 index points = $1.00
Disclaimer:
• What presented here is not a recommendation, please consult your licensed broker.
• Our mission is to create lateral thinking skills for every investor and trader, knowing when to take a calculated risk with market uncertainty and a bolder risk when opportunity arises.
CME Real-time Market Data help identify trading set-ups in real-time and express my market views. If you have futures in your trading portfolio, you can check out on CME Group data plans available that suit your trading needs tradingview.com/cme/

konhow@weipedia.com
Powiązane publikacje
Wyłączenie odpowiedzialności
Informacje i publikacje nie stanowią i nie powinny być traktowane jako porady finansowe, inwestycyjne, tradingowe ani jakiekolwiek inne rekomendacje dostarczane lub zatwierdzone przez TradingView. Więcej informacji znajduje się w Warunkach użytkowania.
Powiązane publikacje
Wyłączenie odpowiedzialności
Informacje i publikacje nie stanowią i nie powinny być traktowane jako porady finansowe, inwestycyjne, tradingowe ani jakiekolwiek inne rekomendacje dostarczane lub zatwierdzone przez TradingView. Więcej informacji znajduje się w Warunkach użytkowania.