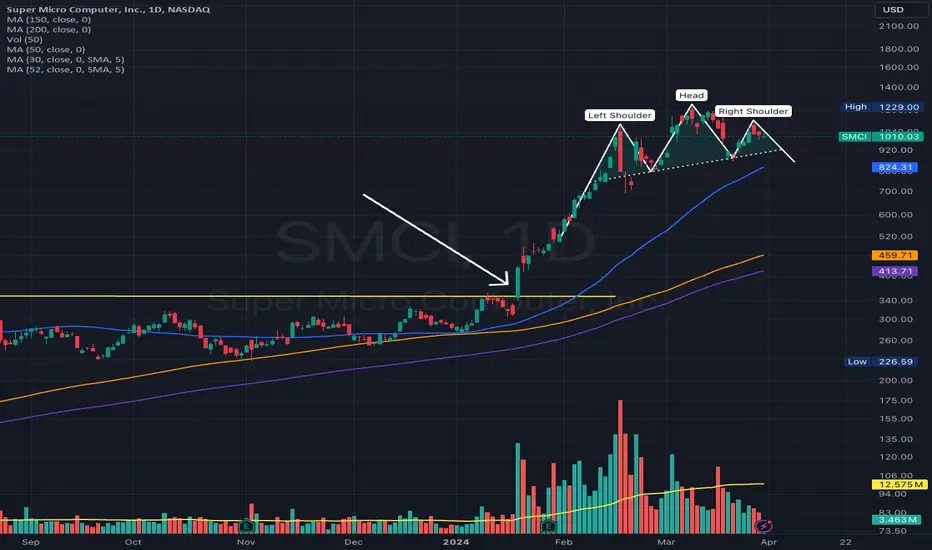
 SMCI is a clear leader during this bull market. However, after a 260% run-up from a previous buy point as shown on the chart, the stock is struggling to move up further.
Now it might slowly form a Head & Shoulders Pattern, and a breakdown through the neckline would signal a sell.
Interestingly, the neckline is right near the 50-day moving average (blue line), therefore a breakdown there will be an even stronger sell signal.
Uwaga
On April 9, 2024, the stock already moved down the neckline. However, to be clear, I absolutely do not plan to short SMCI or any other stocks. I am looking for reversal pattern at the top ONLY to sell which I have already bought, to close the trade.
Shorting stocks, especially tech stocks, in my opinion, is very risky.

Wyłączenie odpowiedzialności
Informacje i publikacje nie stanowią i nie powinny być traktowane jako porady finansowe, inwestycyjne, tradingowe ani jakiekolwiek inne rekomendacje dostarczane lub zatwierdzone przez TradingView. Więcej informacji znajduje się w Warunkach użytkowania.
Wyłączenie odpowiedzialności
Informacje i publikacje nie stanowią i nie powinny być traktowane jako porady finansowe, inwestycyjne, tradingowe ani jakiekolwiek inne rekomendacje dostarczane lub zatwierdzone przez TradingView. Więcej informacji znajduje się w Warunkach użytkowania.