
Hello There,
welcome to my new analysis about SanDisk (SNDK) from the daily timeframe perspective. In recent times the stock has shown substantial volume and volatility increases. A lot of demand increased and led to continuously higher highs. Right now, I spotted a major formation that the stock completed recently.
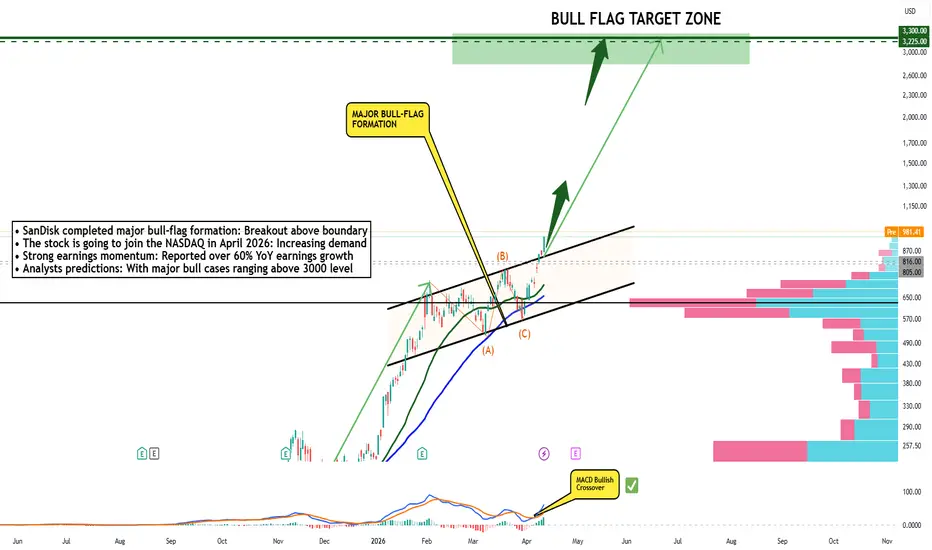
As shown in my chart, the stock has formed this major bull flag formation. Such a formation is, in most cases, a continuation formation. The stock already developed a huge flagpole previously. The breakout above the upper boundary now confirmed the same length towards the upside.
The stock also increased with strong bullish pressure above the upper boundary of this key bull flag formation. Now the whole formation has been completed. The completion of this formation has confirmed the upper target zones marked in green in my chart. A lot of analyst predictions also consider this target level realistic.
The stock also has major supports determined by the volume profile. Should the stock reach into these levels again and bounce, confirmation of support is highly likely. There are also major moving average supports. The 50-MA marked in blue and the 25-MA marked in green serve as main support levels from where a bounce and continued bullishness are highly likely.
Right now, the next target zones should be considered to be appointed by bullish price action. Once the upper zones have been reached, further assumptions need to be made.
What do you think about the stock? Are you trading stocks right now?
Let us know in the comments!
VP
welcome to my new analysis about SanDisk (SNDK) from the daily timeframe perspective. In recent times the stock has shown substantial volume and volatility increases. A lot of demand increased and led to continuously higher highs. Right now, I spotted a major formation that the stock completed recently.
As shown in my chart, the stock has formed this major bull flag formation. Such a formation is, in most cases, a continuation formation. The stock already developed a huge flagpole previously. The breakout above the upper boundary now confirmed the same length towards the upside.
The stock also increased with strong bullish pressure above the upper boundary of this key bull flag formation. Now the whole formation has been completed. The completion of this formation has confirmed the upper target zones marked in green in my chart. A lot of analyst predictions also consider this target level realistic.
The stock also has major supports determined by the volume profile. Should the stock reach into these levels again and bounce, confirmation of support is highly likely. There are also major moving average supports. The 50-MA marked in blue and the 25-MA marked in green serve as main support levels from where a bounce and continued bullishness are highly likely.
Right now, the next target zones should be considered to be appointed by bullish price action. Once the upper zones have been reached, further assumptions need to be made.
What do you think about the stock? Are you trading stocks right now?
Let us know in the comments!
VP
Zlecenie aktywne

►✅JOIN THE BEST+ TOP TELEGRAM TRADING CHANNEL: t.me/VincePrinceForexGoldStocks
►🚀Join Premium Channels: bit.ly/4bUD8N8
►🔥JOIN BYBIT TOP EXCHANGE►🎁 UP TO $30,000 BONUS NOW: partner.bybit.com/b/VinceByBit
►🚀Join Premium Channels: bit.ly/4bUD8N8
►🔥JOIN BYBIT TOP EXCHANGE►🎁 UP TO $30,000 BONUS NOW: partner.bybit.com/b/VinceByBit
Wyłączenie odpowiedzialności
Informacje i publikacje nie stanowią i nie powinny być traktowane jako porady finansowe, inwestycyjne, tradingowe ani jakiekolwiek inne rekomendacje dostarczane lub zatwierdzone przez TradingView. Więcej informacji znajduje się w Warunkach użytkowania.
►✅JOIN THE BEST+ TOP TELEGRAM TRADING CHANNEL: t.me/VincePrinceForexGoldStocks
►🚀Join Premium Channels: bit.ly/4bUD8N8
►🔥JOIN BYBIT TOP EXCHANGE►🎁 UP TO $30,000 BONUS NOW: partner.bybit.com/b/VinceByBit
►🚀Join Premium Channels: bit.ly/4bUD8N8
►🔥JOIN BYBIT TOP EXCHANGE►🎁 UP TO $30,000 BONUS NOW: partner.bybit.com/b/VinceByBit
Wyłączenie odpowiedzialności
Informacje i publikacje nie stanowią i nie powinny być traktowane jako porady finansowe, inwestycyjne, tradingowe ani jakiekolwiek inne rekomendacje dostarczane lub zatwierdzone przez TradingView. Więcej informacji znajduje się w Warunkach użytkowania.