
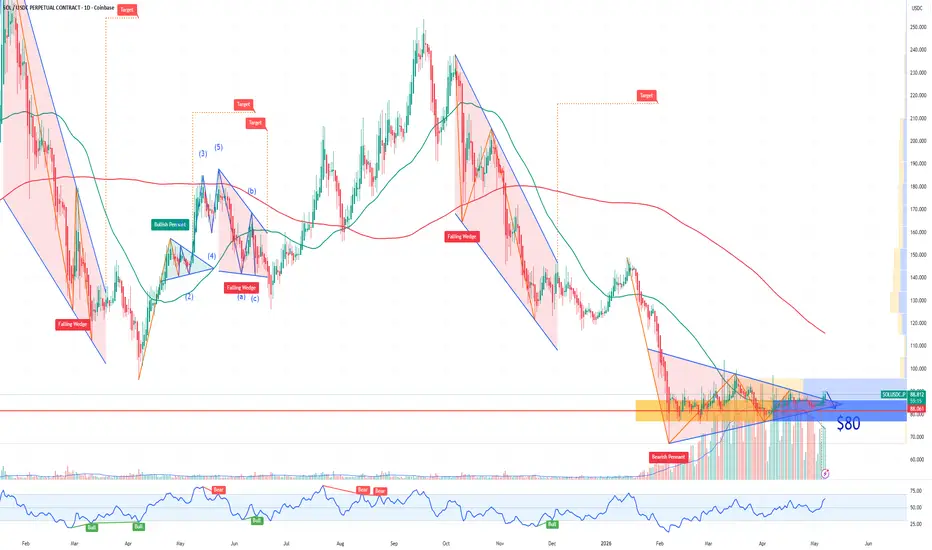
If you haven`t bough the dip on Solana:
$80 is a major psychological and technical support zone, remains a realistic near-term scenario for SOL Solana .
Bear case:
Critical technical support at risk: $80 has acted as a strong floor multiple times in 2026 (February–April). SOL is forming a short-term descending pattern; failure to hold above $88–$90 and reclaim the 100-day EMA (~$98) would likely trigger a pullback straight to the $80 zone.
Macro headwinds for high-beta assets: Persistent sticky inflation and the Fed’s cautious stance on rate cuts continue to weigh on risk-on assets. Solana, being highly correlated with Bitcoin and broader risk sentiment, suffers first in any risk-off move or equity correction.
On-chain and sentiment fatigue: While ecosystem activity is solid, retail participation has cooled and ETF inflows have slowed after six straight months of declines in some periods. Whale distribution on rallies and lack of fresh catalysts.
What serious analysts & outlets are saying:
CryptoRank / CoinJournal: $80 is the make-or-break level — a daily close below it could accelerate selling.
Bitpanda & CoinCodex: Conservative 2026 scenarios see SOL grinding back toward $80–$90 if macro pressure persists and upgrades (Firedancer/Alpenglow) don’t deliver immediate hype.
InvestingHaven & multiple technicians: $75–$80 range is the lower bound of the 2026 working range in a base-to-bear case; a 10–15% correction from current levels is “very plausible” without strong BTC momentum.
$80 is a major psychological and technical support zone, remains a realistic near-term scenario for SOL Solana .
Bear case:
Critical technical support at risk: $80 has acted as a strong floor multiple times in 2026 (February–April). SOL is forming a short-term descending pattern; failure to hold above $88–$90 and reclaim the 100-day EMA (~$98) would likely trigger a pullback straight to the $80 zone.
Macro headwinds for high-beta assets: Persistent sticky inflation and the Fed’s cautious stance on rate cuts continue to weigh on risk-on assets. Solana, being highly correlated with Bitcoin and broader risk sentiment, suffers first in any risk-off move or equity correction.
On-chain and sentiment fatigue: While ecosystem activity is solid, retail participation has cooled and ETF inflows have slowed after six straight months of declines in some periods. Whale distribution on rallies and lack of fresh catalysts.
What serious analysts & outlets are saying:
CryptoRank / CoinJournal: $80 is the make-or-break level — a daily close below it could accelerate selling.
Bitpanda & CoinCodex: Conservative 2026 scenarios see SOL grinding back toward $80–$90 if macro pressure persists and upgrades (Firedancer/Alpenglow) don’t deliver immediate hype.
InvestingHaven & multiple technicians: $75–$80 range is the lower bound of the 2026 working range in a base-to-bear case; a 10–15% correction from current levels is “very plausible” without strong BTC momentum.

DAILY PRIVATE HIGH-CONVICTION OPTIONS SIGNALS: patreon.com/PremiumOptionsSignals
Trading COURSE bit.ly/tradex
RESULTS bit.ly/TG99x
CRYPTOS partner.bybit.com/b/37880
BUY-SELL INDICATORS tradingindicators.store/
Trading COURSE bit.ly/tradex
RESULTS bit.ly/TG99x
CRYPTOS partner.bybit.com/b/37880
BUY-SELL INDICATORS tradingindicators.store/
Powiązane publikacje
Wyłączenie odpowiedzialności
Informacje i publikacje nie stanowią i nie powinny być traktowane jako porady finansowe, inwestycyjne, tradingowe ani jakiekolwiek inne rekomendacje dostarczane lub zatwierdzone przez TradingView. Więcej informacji znajduje się w Warunkach użytkowania.
DAILY PRIVATE HIGH-CONVICTION OPTIONS SIGNALS: patreon.com/PremiumOptionsSignals
Trading COURSE bit.ly/tradex
RESULTS bit.ly/TG99x
CRYPTOS partner.bybit.com/b/37880
BUY-SELL INDICATORS tradingindicators.store/
Trading COURSE bit.ly/tradex
RESULTS bit.ly/TG99x
CRYPTOS partner.bybit.com/b/37880
BUY-SELL INDICATORS tradingindicators.store/
Powiązane publikacje
Wyłączenie odpowiedzialności
Informacje i publikacje nie stanowią i nie powinny być traktowane jako porady finansowe, inwestycyjne, tradingowe ani jakiekolwiek inne rekomendacje dostarczane lub zatwierdzone przez TradingView. Więcej informacji znajduje się w Warunkach użytkowania.