
🔍 Overall Market Structure
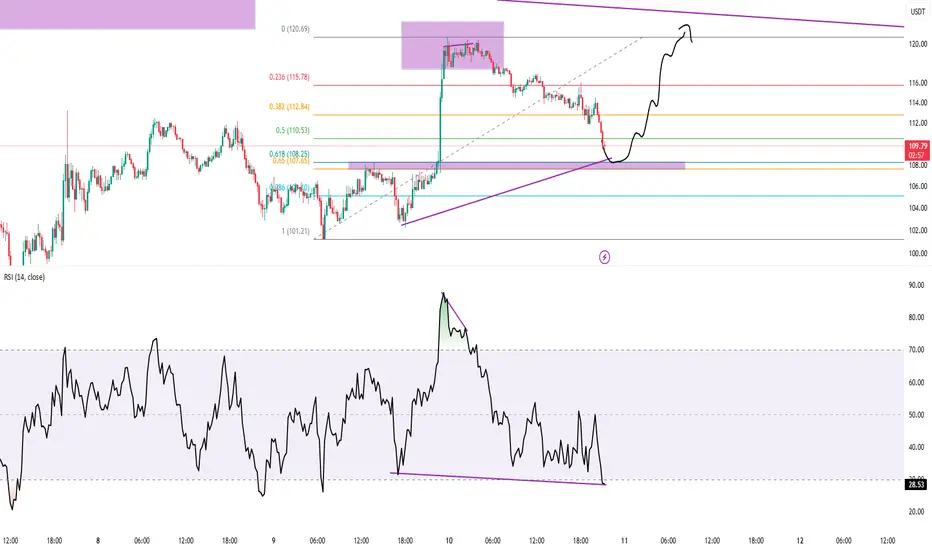
The price recently saw a sharp drop from the $120.69 high and is currently consolidating around the $108–110 area.
A bullish structure is forming, suggested by the potential for a reversal pattern from a support zone.
🧠 Key Technical Components
📉 Fibonacci Levels (retracement from $101.21 to $120.69):
0.236 – $115.78 (resistance)
0.382 – $112.84
0.5 – $110.53
0.618 – $108.25 ← Current support
0.786 – $105.20
Price is bouncing from the 0.618 zone, a strong reversal area.
🟣 RSI (Relative Strength Index):
RSI is near oversold (31.15) and showing bullish divergence:
Price made lower lows.
RSI made higher lows.
This divergence suggests momentum is weakening on the downside, signaling a potential bullish reversal.
🟪 Support & Resistance Zones:
Demand Zone (support) around $107–108 (marked with purple box).
Supply Zone (resistance) around $118–120.
Price could bounce from support, targeting higher fib levels and possibly retesting the supply zone.
✏️ Projected Price Action (Black Curve):
Anticipated short-term reversal from $108.
Price might climb through:
$110 (0.5 fib)
$112.84 (0.382 fib)
Potentially to $115.78 (0.236 fib) or even back to the $120.69 high.
Shown within a larger wedge structure, so upper trendline resistance around $120.
✅ Conclusion:
Bullish reversal likely from $107–108 support.
RSI divergence + Fibonacci confluence supports the reversal thesis.
Next targets: $110.50 → $112.84 → $115.78 with final resistance near $120.69.
The price recently saw a sharp drop from the $120.69 high and is currently consolidating around the $108–110 area.
A bullish structure is forming, suggested by the potential for a reversal pattern from a support zone.
🧠 Key Technical Components
📉 Fibonacci Levels (retracement from $101.21 to $120.69):
0.236 – $115.78 (resistance)
0.382 – $112.84
0.5 – $110.53
0.618 – $108.25 ← Current support
0.786 – $105.20
Price is bouncing from the 0.618 zone, a strong reversal area.
🟣 RSI (Relative Strength Index):
RSI is near oversold (31.15) and showing bullish divergence:
Price made lower lows.
RSI made higher lows.
This divergence suggests momentum is weakening on the downside, signaling a potential bullish reversal.
🟪 Support & Resistance Zones:
Demand Zone (support) around $107–108 (marked with purple box).
Supply Zone (resistance) around $118–120.
Price could bounce from support, targeting higher fib levels and possibly retesting the supply zone.
✏️ Projected Price Action (Black Curve):
Anticipated short-term reversal from $108.
Price might climb through:
$110 (0.5 fib)
$112.84 (0.382 fib)
Potentially to $115.78 (0.236 fib) or even back to the $120.69 high.
Shown within a larger wedge structure, so upper trendline resistance around $120.
✅ Conclusion:
Bullish reversal likely from $107–108 support.
RSI divergence + Fibonacci confluence supports the reversal thesis.
Next targets: $110.50 → $112.84 → $115.78 with final resistance near $120.69.

Wyłączenie odpowiedzialności
Informacje i publikacje nie stanowią i nie powinny być traktowane jako porady finansowe, inwestycyjne, tradingowe ani jakiekolwiek inne rekomendacje dostarczane lub zatwierdzone przez TradingView. Więcej informacji znajduje się w Warunkach użytkowania.
Wyłączenie odpowiedzialności
Informacje i publikacje nie stanowią i nie powinny być traktowane jako porady finansowe, inwestycyjne, tradingowe ani jakiekolwiek inne rekomendacje dostarczane lub zatwierdzone przez TradingView. Więcej informacji znajduje się w Warunkach użytkowania.