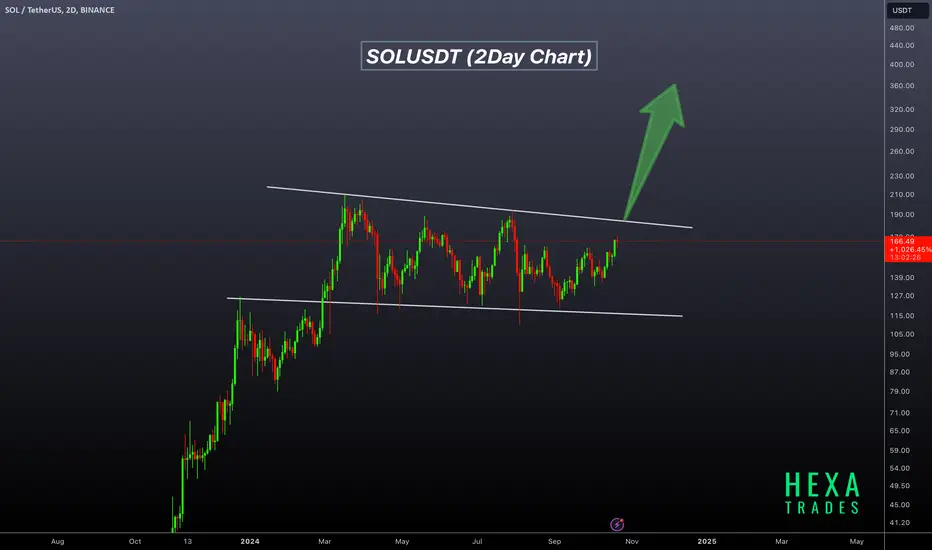
SOLUSDT Technical analysis update
SOLUSDT has been forming a bullish flag pattern over the last 230 days. The price is now moving toward the flag resistance line for a potential breakout. Once the breakout occurs, we can expect a price move of 50% to 150%. Additionally, the price is trading above the 100 and 200 EMA on the daily chart.
Buy level: After confirmation of the breakout from the flag pattern.
SOLUSDT has been forming a bullish flag pattern over the last 230 days. The price is now moving toward the flag resistance line for a potential breakout. Once the breakout occurs, we can expect a price move of 50% to 150%. Additionally, the price is trading above the 100 and 200 EMA on the daily chart.
Buy level: After confirmation of the breakout from the flag pattern.
Zlecenie aktywne
SOLUSDT price is about to break flag resistance.Buy after the price breaks the resistance line.
Zlecenie aktywne

 SOLUSDT bullish flag pattern breakout confirmed!

🚀Telegram : t.me/hexatrades
🌐Website: hexatrades.io/
🗣️Twitter(X): twitter.com/HexaTrades
🌐Website: hexatrades.io/
🗣️Twitter(X): twitter.com/HexaTrades
Powiązane publikacje
Wyłączenie odpowiedzialności
Informacje i publikacje nie stanowią i nie powinny być traktowane jako porady finansowe, inwestycyjne, tradingowe ani jakiekolwiek inne rekomendacje dostarczane lub zatwierdzone przez TradingView. Więcej informacji znajduje się w Warunkach użytkowania.
🚀Telegram : t.me/hexatrades
🌐Website: hexatrades.io/
🗣️Twitter(X): twitter.com/HexaTrades
🌐Website: hexatrades.io/
🗣️Twitter(X): twitter.com/HexaTrades
Powiązane publikacje
Wyłączenie odpowiedzialności
Informacje i publikacje nie stanowią i nie powinny być traktowane jako porady finansowe, inwestycyjne, tradingowe ani jakiekolwiek inne rekomendacje dostarczane lub zatwierdzone przez TradingView. Więcej informacji znajduje się w Warunkach użytkowania.