
Solana (SOL) technical analysis:
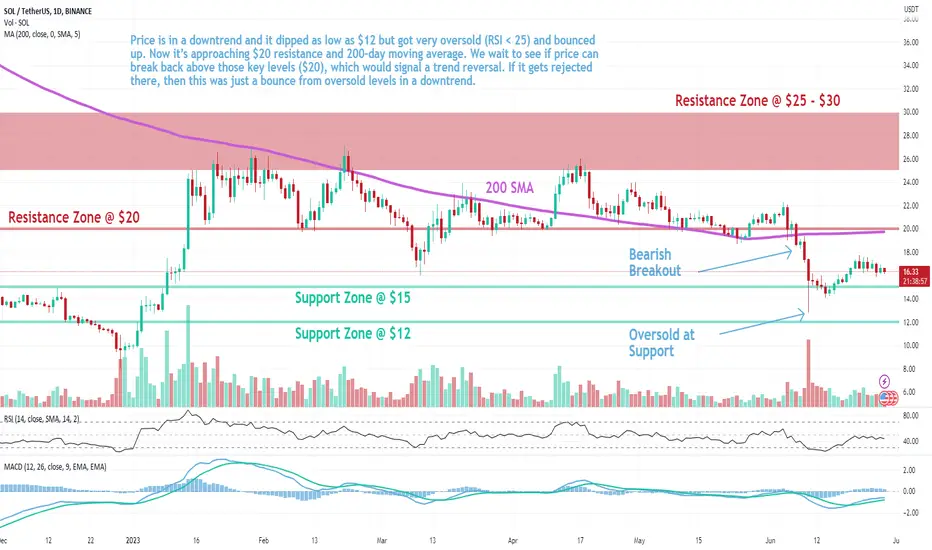
Trade setup: Price is in a downtrend and it dipped as low as $12 but got very oversold (RSI < 25) and bounced up. Now it’s approaching $20 resistance and 200-day moving average. We wait to see if price can break back above those key levels ($20), which would signal a trend reversal. If it gets rejected there, then this was just a bounce from oversold levels in a downtrend.
Trend: Downtrend across all time horizons (Short- Medium- and Long-Term).
Momentum is Mixed as MACD Line is above MACD Signal Line (Bullish) but RSI ~ 50 (Neutral).
Support and Resistance: Nearest Support Zone is $15, then $12. The nearest Resistance Zone is $20 (previous support), then $25 – $30.
Trade setup: Price is in a downtrend and it dipped as low as $12 but got very oversold (RSI < 25) and bounced up. Now it’s approaching $20 resistance and 200-day moving average. We wait to see if price can break back above those key levels ($20), which would signal a trend reversal. If it gets rejected there, then this was just a bounce from oversold levels in a downtrend.
Trend: Downtrend across all time horizons (Short- Medium- and Long-Term).
Momentum is Mixed as MACD Line is above MACD Signal Line (Bullish) but RSI ~ 50 (Neutral).
Support and Resistance: Nearest Support Zone is $15, then $12. The nearest Resistance Zone is $20 (previous support), then $25 – $30.

Wyłączenie odpowiedzialności
Informacje i publikacje nie stanowią i nie powinny być traktowane jako porady finansowe, inwestycyjne, tradingowe ani jakiekolwiek inne rekomendacje dostarczane lub zatwierdzone przez TradingView. Więcej informacji znajduje się w Warunkach użytkowania.
Wyłączenie odpowiedzialności
Informacje i publikacje nie stanowią i nie powinny być traktowane jako porady finansowe, inwestycyjne, tradingowe ani jakiekolwiek inne rekomendacje dostarczane lub zatwierdzone przez TradingView. Więcej informacji znajduje się w Warunkach użytkowania.