
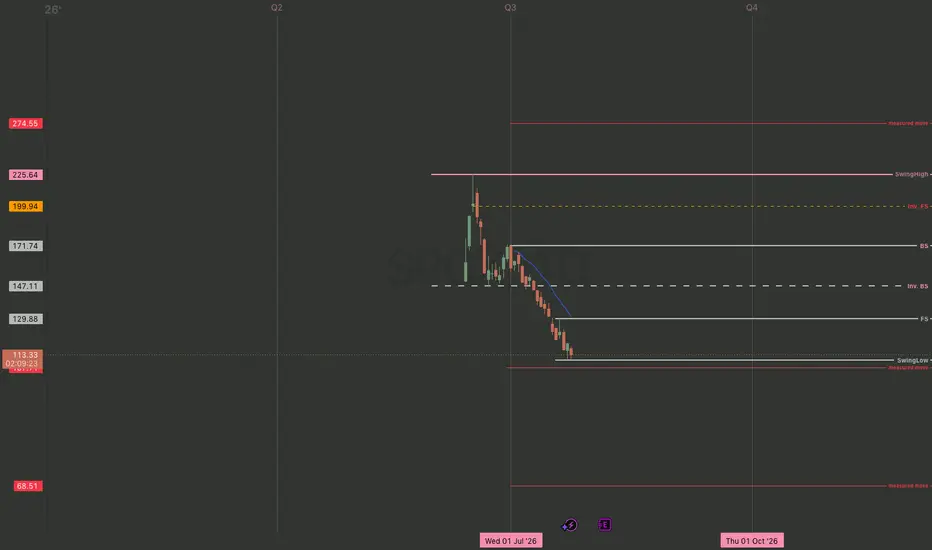
Space Exploration Technologies Corp (SpaceX)||
MARKET-BEATING SCORE = 1/10
Dividend yield TTM
0.13%
"designs, manufactures, and launches advanced rockets and spacecraft, including the fully reusable Starship and Super Heavy rocket system, targeting missions to Earth orbit, the Moon, Mars, and beyond."
-----------------------------------
EPS growth -26830.0% — declining.
Revenue growing 33.2% YoY — strong.
Gross margin 48.8% — decent.
FCF margin 0.0% — cash burn.
D/E 0.00 — conservative leverage.
-----------------------------------
KEY RISK ASSESSMENT
"Could a policy change or major competitor disrupt growth in the next 2 years?"
SpaceX faces moderate risk from regulatory shifts regarding orbital traffic management and spectrum rights as rivals like Amazon's Project Kuiper begin deployment. Increased global scrutiny over satellite density and potential debris could lead to more restrictive licensing environments, while terrestrial 5G expansion continues to challenge Starlink's growth in rural markets. Despite these factors, the company's vertical integration and established launch frequency provide a substantial buffer against immediate competitive disruption.
Risk Level:
Moderate
----------------------------------
POSITIVE CATALYST OUTLOOK
"Could a policy change or competitor headwinds create a positive catalyst in the next 2 years?"
SpaceX stands to benefit significantly from potential FAA regulatory streamlining and increased Pentagon spending on Starshield, creating a robust policy tailwind for its Communication Services segment. Major competitors like Amazon’s Project Kuiper face continued deployment delays, while traditional satellite providers struggle to match SpaceX's superior launch cadence and lower cost-to-orbit. Furthermore, the operational scaling of Starship could drastically reduce margins for competitors, cementing SpaceX's dominant market position through unmatched vertical integration and cost advantages.
Positive Outlook:
High
-----------------------------------
Multiple Time-Frame Analysis; Color Code | Strength favors the higher timeframe.
Yearly timeframe = black
Monthly timeframe = pink
weekly = grey
daily = red
4hr = orange
1hr = yellow
15min = blue
5min = green if they are shown. (Level visibility on intervals is set to timeframe the level was found on and below to keep chart view organized.)
** Candle Science explained **
A Range = two or more consecutive color candles.
There are two types of ranges - accumulation and distribution. **A single candle is a range on a lower timeframe. *Find the range and define its, creation dates, prices, and risk parameters. A range is broken down into 4 candle, which create 6 levels that define the range and illustrate market structure.
Focus only on the first and last candle of each range. The last candle of each type of range has two levels - see FS & Inv. FS Candles below.
DISTRIBUTION RANGES DEFINED:
When price is above a distribution range, these candles/levels act as support.
(BS) BACKSIDE Candle - First distribution candle in a distribution range. Expectation = strong reaction to price. long wicks reaching to or away from level. high angle accumulation trends, f.v,g's
(FS) FrontSide Candle - Last distribution candle in a distribution range. Expectation = reversal, create a low angle accumulation trend. The top of Distribution candles are used as support. The bottom of the FrontSide candle is the SwingLow of the range. The FS candle wants to protect the SwingLow. When/if Price Action closes below the SwingLow, the level is invalidated. Find another range to trade.
ACCUMULATION RANGES DEFINED: When price is below an accumulation range, these candles/levels act as resistance.
INVERSE BACKSIDE (Inv.BS) - First Accumulation candle in an accumulation range. Expectation. = strong reaction to price. long wicks reaching to or away from level. Creates high angle distribution trends, f.v.g, protects the Inv.FS candle
INVERSE FRONTSIDE (Inv.FS) - Last accumulation candle in an accumulation range. Expectation = reversal, create a low angle distribution trend. The bottom of Accumulation candles are used as resistance.
The top of the Inv.FrontSide candle is the SwingHigh of the range. The Inv.FS candle wants to protect the SwingHigh. When/if Price Action closes above the SwingHigh, the level is invalidated. Find another range to trade.
MARKET-BEATING SCORE = 1/10
Dividend yield TTM
0.13%
"designs, manufactures, and launches advanced rockets and spacecraft, including the fully reusable Starship and Super Heavy rocket system, targeting missions to Earth orbit, the Moon, Mars, and beyond."
-----------------------------------
EPS growth -26830.0% — declining.
Revenue growing 33.2% YoY — strong.
Gross margin 48.8% — decent.
FCF margin 0.0% — cash burn.
D/E 0.00 — conservative leverage.
-----------------------------------
KEY RISK ASSESSMENT
"Could a policy change or major competitor disrupt growth in the next 2 years?"
SpaceX faces moderate risk from regulatory shifts regarding orbital traffic management and spectrum rights as rivals like Amazon's Project Kuiper begin deployment. Increased global scrutiny over satellite density and potential debris could lead to more restrictive licensing environments, while terrestrial 5G expansion continues to challenge Starlink's growth in rural markets. Despite these factors, the company's vertical integration and established launch frequency provide a substantial buffer against immediate competitive disruption.
Risk Level:
Moderate
----------------------------------
POSITIVE CATALYST OUTLOOK
"Could a policy change or competitor headwinds create a positive catalyst in the next 2 years?"
SpaceX stands to benefit significantly from potential FAA regulatory streamlining and increased Pentagon spending on Starshield, creating a robust policy tailwind for its Communication Services segment. Major competitors like Amazon’s Project Kuiper face continued deployment delays, while traditional satellite providers struggle to match SpaceX's superior launch cadence and lower cost-to-orbit. Furthermore, the operational scaling of Starship could drastically reduce margins for competitors, cementing SpaceX's dominant market position through unmatched vertical integration and cost advantages.
Positive Outlook:
High
-----------------------------------
Multiple Time-Frame Analysis; Color Code | Strength favors the higher timeframe.
Yearly timeframe = black
Monthly timeframe = pink
weekly = grey
daily = red
4hr = orange
1hr = yellow
15min = blue
5min = green if they are shown. (Level visibility on intervals is set to timeframe the level was found on and below to keep chart view organized.)
** Candle Science explained **
A Range = two or more consecutive color candles.
There are two types of ranges - accumulation and distribution. **A single candle is a range on a lower timeframe. *Find the range and define its, creation dates, prices, and risk parameters. A range is broken down into 4 candle, which create 6 levels that define the range and illustrate market structure.
Focus only on the first and last candle of each range. The last candle of each type of range has two levels - see FS & Inv. FS Candles below.
DISTRIBUTION RANGES DEFINED:
When price is above a distribution range, these candles/levels act as support.
(BS) BACKSIDE Candle - First distribution candle in a distribution range. Expectation = strong reaction to price. long wicks reaching to or away from level. high angle accumulation trends, f.v,g's
(FS) FrontSide Candle - Last distribution candle in a distribution range. Expectation = reversal, create a low angle accumulation trend. The top of Distribution candles are used as support. The bottom of the FrontSide candle is the SwingLow of the range. The FS candle wants to protect the SwingLow. When/if Price Action closes below the SwingLow, the level is invalidated. Find another range to trade.
ACCUMULATION RANGES DEFINED: When price is below an accumulation range, these candles/levels act as resistance.
INVERSE BACKSIDE (Inv.BS) - First Accumulation candle in an accumulation range. Expectation. = strong reaction to price. long wicks reaching to or away from level. Creates high angle distribution trends, f.v.g, protects the Inv.FS candle
INVERSE FRONTSIDE (Inv.FS) - Last accumulation candle in an accumulation range. Expectation = reversal, create a low angle distribution trend. The bottom of Accumulation candles are used as resistance.
The top of the Inv.FrontSide candle is the SwingHigh of the range. The Inv.FS candle wants to protect the SwingHigh. When/if Price Action closes above the SwingHigh, the level is invalidated. Find another range to trade.

Wyłączenie odpowiedzialności
Informacje i publikacje nie stanowią i nie powinny być traktowane jako porady finansowe, inwestycyjne, tradingowe ani jakiekolwiek inne rekomendacje dostarczane lub zatwierdzone przez TradingView. Więcej informacji znajduje się w Warunkach użytkowania.
Wyłączenie odpowiedzialności
Informacje i publikacje nie stanowią i nie powinny być traktowane jako porady finansowe, inwestycyjne, tradingowe ani jakiekolwiek inne rekomendacje dostarczane lub zatwierdzone przez TradingView. Więcej informacji znajduje się w Warunkach użytkowania.