
Hi guys,
I saw a lot of fake guru comparing '16/'20 with todays'.
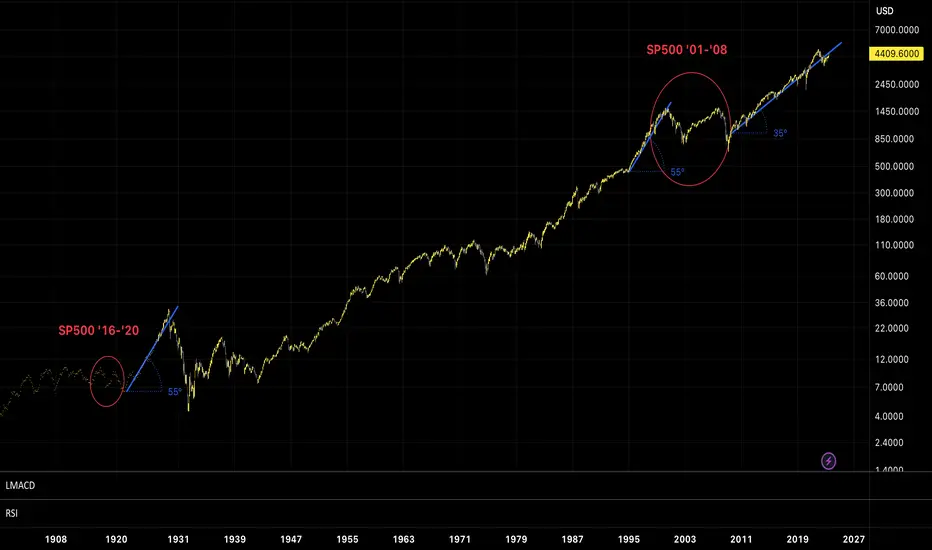
But in my mind is not true because if we compare '16/'20 with '01/'08 we all tend to agree the chart is so similar, but as u can see the rise after '08 crash is not in parabolic mode.
Could I'll be wrong? Of course, but if u find someone who compares chart randomly, unfollow immediately.
Let's see.
I saw a lot of fake guru comparing '16/'20 with todays'.
But in my mind is not true because if we compare '16/'20 with '01/'08 we all tend to agree the chart is so similar, but as u can see the rise after '08 crash is not in parabolic mode.
Could I'll be wrong? Of course, but if u find someone who compares chart randomly, unfollow immediately.
Let's see.

Powiązane publikacje
Wyłączenie odpowiedzialności
Informacje i publikacje nie stanowią i nie powinny być traktowane jako porady finansowe, inwestycyjne, tradingowe ani jakiekolwiek inne rekomendacje dostarczane lub zatwierdzone przez TradingView. Więcej informacji znajduje się w Warunkach użytkowania.
Powiązane publikacje
Wyłączenie odpowiedzialności
Informacje i publikacje nie stanowią i nie powinny być traktowane jako porady finansowe, inwestycyjne, tradingowe ani jakiekolwiek inne rekomendacje dostarczane lub zatwierdzone przez TradingView. Więcej informacji znajduje się w Warunkach użytkowania.