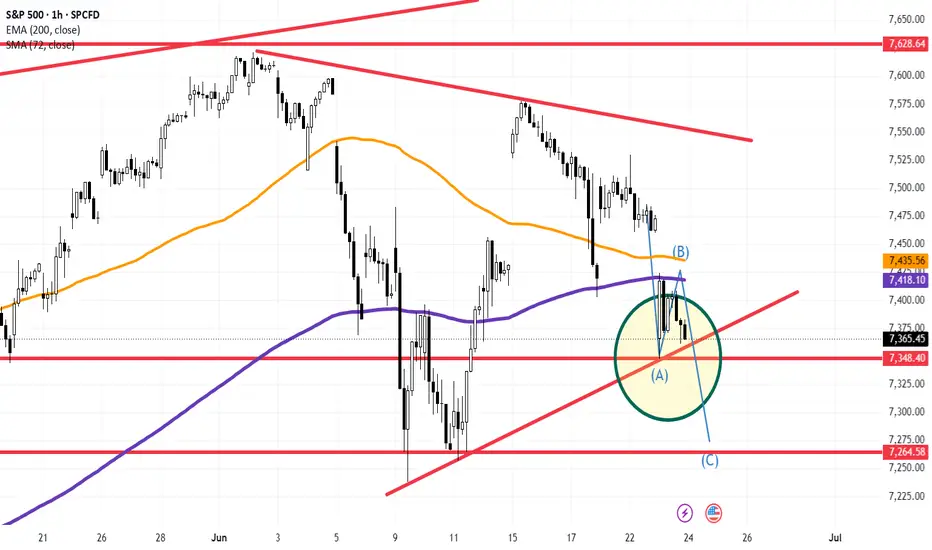
S&P 500 (SPX) 1H: Breaching $7,348 Trigger Zone Activates Corrective Wave C Target Near $7,264 Support
### 🇺🇸 S&P 500 Index (SPX) 1H Intraday Technical Structure (Ref: SPX_2026-06-24_08-41-11.png)
We are highlighting a critical tactical setup on the S&P 500 ( SPX - SPCFD) on the 1-Hour (1H) timeframe. The broader US equity market is flashing near-term structural distribution patterns, consolidating inside an explicit institutional inflection zone.
The index is currently printing slightly lower at **7,365.45 (-0.17%)**, compressing right above major diagonal support parameters.
---
### 🔍 Technical Breakdown & The ABC Corrective Framework:
1. **Dynamic Moving Average Resistance:** The index has cleanly broken below both the fast **72-period SMA (orange line at 7,435.56)** and the institutional **200-period EMA (purple line at 7,418.10)**. This shifting sequence converts these former floors into active supply clusters capping near-term relief bounces.
2. **The Inflection Node (Green Circle):** Price action is currently trapped in a tightening wedge formed by the descending corrective Wave (B) peak and the ascending primary **Line of Trend (LTA)** (lower red diagonal line).
---
### 🎯 The Bearish Trigger & Wave 3 / C Projections:
Our positional matrix details a highly systematic, two-tiered directional blueprint as the current compression nears its terminal breakout point:
* **The Primary Breakdown Trigger ($7,348.40):** The defining line of defense for buyers is locked at the horizontal static support floor plotted at **7,348.40** (intermediate horizontal red line). A clean hourly candle close below this level will invalidate the immediate local accumulation structure.
* **The Downside Extension Target ($7,264.58 Area):** Confirming the violation of the $7,348 baseline will unlock a direct momentum flush. Utilizing an Elliott Wave/expansion framework, this downward wave (marked as Wave C) projects a high-velocity extension towards the next major institutional demand zone established at **7,264.58** (thick lower horizontal red line). This cluster represents a massive historical support structural floor where aggressive buying absorption is anticipated.
### Tactical Strategy:
We maintain a defensive stance on near-term long exposure until clarity emerges. Momentum players will look for short setups upon a confirmed structural break of the **7,348** cluster, defining risk above the recent Wave (B) high. Conversely, swing traders should monitor the **7,264** region closely for potential high-asymmetry reversal candle patterns.
---
📊 **ChartPro Data**
*US Indices Architecture, Elliott Wave Corrective Mechanics & Systematic Trigger Routing.*
⚠️ **Disclaimer:** For educational and informational purposes only. This market update represents a personal trading framework and does not constitute financial or investment advice.
### 🇺🇸 S&P 500 Index (SPX) 1H Intraday Technical Structure (Ref: SPX_2026-06-24_08-41-11.png)
We are highlighting a critical tactical setup on the S&P 500 (
SPX - SPCFD) on the 1-Hour (1H) timeframe. The broader US equity market is flashing near-term structural distribution patterns, consolidating inside an explicit institutional inflection zone.The index is currently printing slightly lower at **7,365.45 (-0.17%)**, compressing right above major diagonal support parameters.
---
### 🔍 Technical Breakdown & The ABC Corrective Framework:
1. **Dynamic Moving Average Resistance:** The index has cleanly broken below both the fast **72-period SMA (orange line at 7,435.56)** and the institutional **200-period EMA (purple line at 7,418.10)**. This shifting sequence converts these former floors into active supply clusters capping near-term relief bounces.
2. **The Inflection Node (Green Circle):** Price action is currently trapped in a tightening wedge formed by the descending corrective Wave (B) peak and the ascending primary **Line of Trend (LTA)** (lower red diagonal line).
---
### 🎯 The Bearish Trigger & Wave 3 / C Projections:
Our positional matrix details a highly systematic, two-tiered directional blueprint as the current compression nears its terminal breakout point:
* **The Primary Breakdown Trigger ($7,348.40):** The defining line of defense for buyers is locked at the horizontal static support floor plotted at **7,348.40** (intermediate horizontal red line). A clean hourly candle close below this level will invalidate the immediate local accumulation structure.
* **The Downside Extension Target ($7,264.58 Area):** Confirming the violation of the $7,348 baseline will unlock a direct momentum flush. Utilizing an Elliott Wave/expansion framework, this downward wave (marked as Wave C) projects a high-velocity extension towards the next major institutional demand zone established at **7,264.58** (thick lower horizontal red line). This cluster represents a massive historical support structural floor where aggressive buying absorption is anticipated.
### Tactical Strategy:
We maintain a defensive stance on near-term long exposure until clarity emerges. Momentum players will look for short setups upon a confirmed structural break of the **7,348** cluster, defining risk above the recent Wave (B) high. Conversely, swing traders should monitor the **7,264** region closely for potential high-asymmetry reversal candle patterns.
---
📊 **ChartPro Data**
*US Indices Architecture, Elliott Wave Corrective Mechanics & Systematic Trigger Routing.*
⚠️ **Disclaimer:** For educational and informational purposes only. This market update represents a personal trading framework and does not constitute financial or investment advice.

Wyłączenie odpowiedzialności
Informacje i publikacje nie stanowią i nie powinny być traktowane jako porady finansowe, inwestycyjne, tradingowe ani jakiekolwiek inne rekomendacje dostarczane lub zatwierdzone przez TradingView. Więcej informacji znajduje się w Warunkach użytkowania.
Wyłączenie odpowiedzialności
Informacje i publikacje nie stanowią i nie powinny być traktowane jako porady finansowe, inwestycyjne, tradingowe ani jakiekolwiek inne rekomendacje dostarczane lub zatwierdzone przez TradingView. Więcej informacji znajduje się w Warunkach użytkowania.