
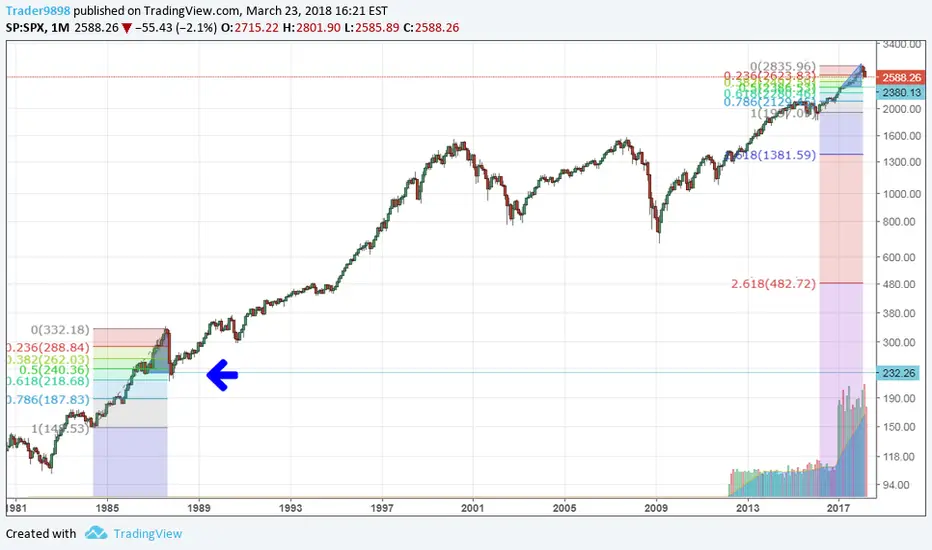
This is a re-post of a chart from one month ago after the dow dropped 700 points in one day. My extrapolation from that post compared this to 1987, in which there was a 2 year run up, and then a quick crash which erased 1 years worth of gains.
While this 2018 crash appears to be slower in time than 1987's two month crash period, the charts nonetheless look the same to me. If we extrapolate, then SPX's current price has only reached half way to where it will eventually bottom out, which should be around 2380.
While this 2018 crash appears to be slower in time than 1987's two month crash period, the charts nonetheless look the same to me. If we extrapolate, then SPX's current price has only reached half way to where it will eventually bottom out, which should be around 2380.

Wyłączenie odpowiedzialności
Informacje i publikacje nie stanowią i nie powinny być traktowane jako porady finansowe, inwestycyjne, tradingowe ani jakiekolwiek inne rekomendacje dostarczane lub zatwierdzone przez TradingView. Więcej informacji znajduje się w Warunkach użytkowania.
Wyłączenie odpowiedzialności
Informacje i publikacje nie stanowią i nie powinny być traktowane jako porady finansowe, inwestycyjne, tradingowe ani jakiekolwiek inne rekomendacje dostarczane lub zatwierdzone przez TradingView. Więcej informacji znajduje się w Warunkach użytkowania.