
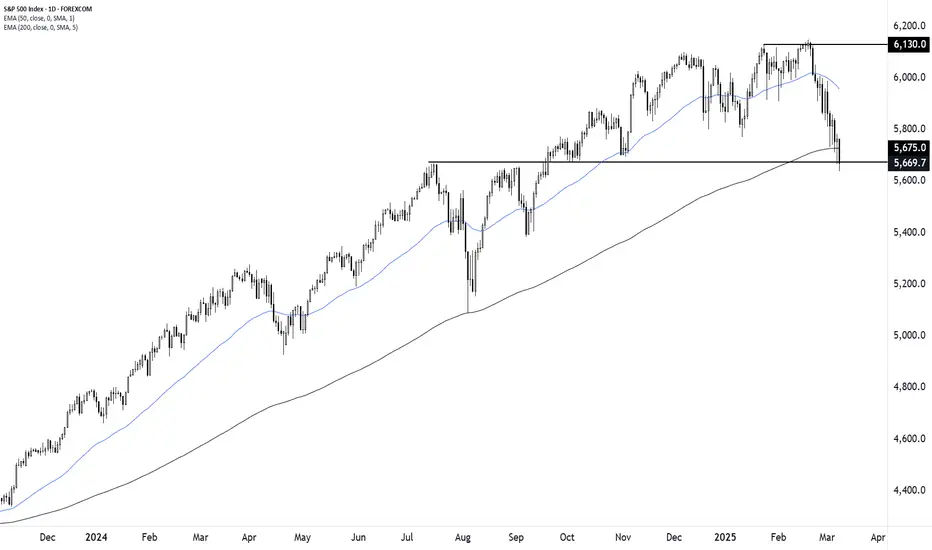
The S&P 500 is showing clear signs of technical weakness as it breaks below a key support level around 5,675, coinciding with the 200-day EMA. This breakdown follows a rejection at 6,130, a recent high that established a resistance zone.
With the index now trading below the 50-day EMA, downside risks are increasing. If the 5,668 level fails to hold, further declines toward the next major support zone could materialize. Traders will be watching for a potential retest of broken support as resistance before determining the next move.
Key Levels to Watch:
📉 Support: 5,668
📈 Resistance: 6,130
-MW

Wyłączenie odpowiedzialności
Informacje i publikacje nie stanowią i nie powinny być traktowane jako porady finansowe, inwestycyjne, tradingowe ani jakiekolwiek inne rekomendacje dostarczane lub zatwierdzone przez TradingView. Więcej informacji znajduje się w Warunkach użytkowania.
Wyłączenie odpowiedzialności
Informacje i publikacje nie stanowią i nie powinny być traktowane jako porady finansowe, inwestycyjne, tradingowe ani jakiekolwiek inne rekomendacje dostarczane lub zatwierdzone przez TradingView. Więcej informacji znajduje się w Warunkach użytkowania.